
Webull Options charts have been improving recently as more traders enjoy Weibull’s innovative feature.
In this tutorial, you will learn how to setup Webull Options charts, read them and get to most from them.
Ultimately, you will be able to leverage all the insights of Webull options charts to increase your options trading profits.
Table of Contents
What Is Webull Options Charts
Just like stocks chart tracks the evolution of the stock price over a period of time, options charts measure the change of the price of options over a period of time.
When you get into an option trade, you want to be able to evaluate how the price of your contract is tracking.
Why Are Webull Options Chart Important?
In fact, I will argue that the Webull options charts can be used for two main purposes:
- Decide when to enter a trade
- Determine when you want to close a trade or take partial profit
The first instance seems obvious because that is the most common question i get from options traders.
“How do I know when to enter a Trade ?”
The second reason for using Webull options charts require a little more knowledge in technical analysis.
In Summary, the main take-away is that your Webull options charts will display other indicators.
In fact, the same technical indicators you use on the Webull stock charts can be displayed on the Webull options charts.
One of those indicators is the Bollinger Bands.
The upper Bollinger Band acts as a natural resistance meaning that when the price of your contract goes outside of the upper Bollinger band, this is an indication to start considering profit taking or scaling out.
Why You Need Webull Options Chart
My answer to options traders to thee question “Why do you need to track the option chart” is as simple as this.
If you are trading options, you must know that the price of the options is derived from other variables than simply the price of the underlying stock.
Therefore, if you are only tracking the price of the underlying stock, you may not fully capture the evolution of the option you are trading.
Consequently, it makes more sense to observe the actual instrument you are trading instead of the main proxy which is the stock chart.
How to Get Webull Options Chart on Webull App
Getting to the Option chart for any stock on Webull app is quite easy.
- Select your desired stock
- Click on “Options” on the Menu to the Right of Charts as shown below
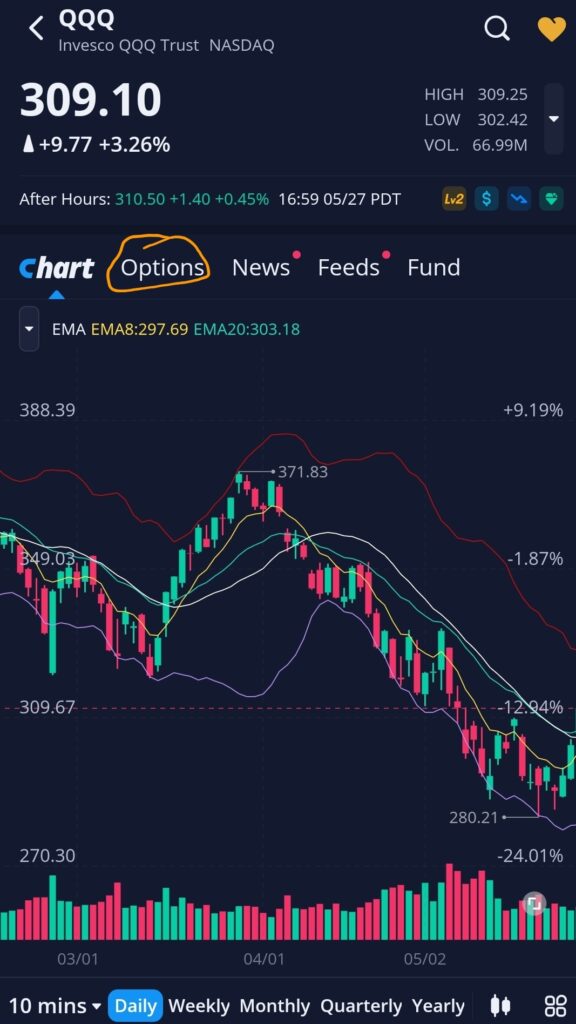
3. Once on the Option chain, Click on the Ask price for the Strike price you want to chart
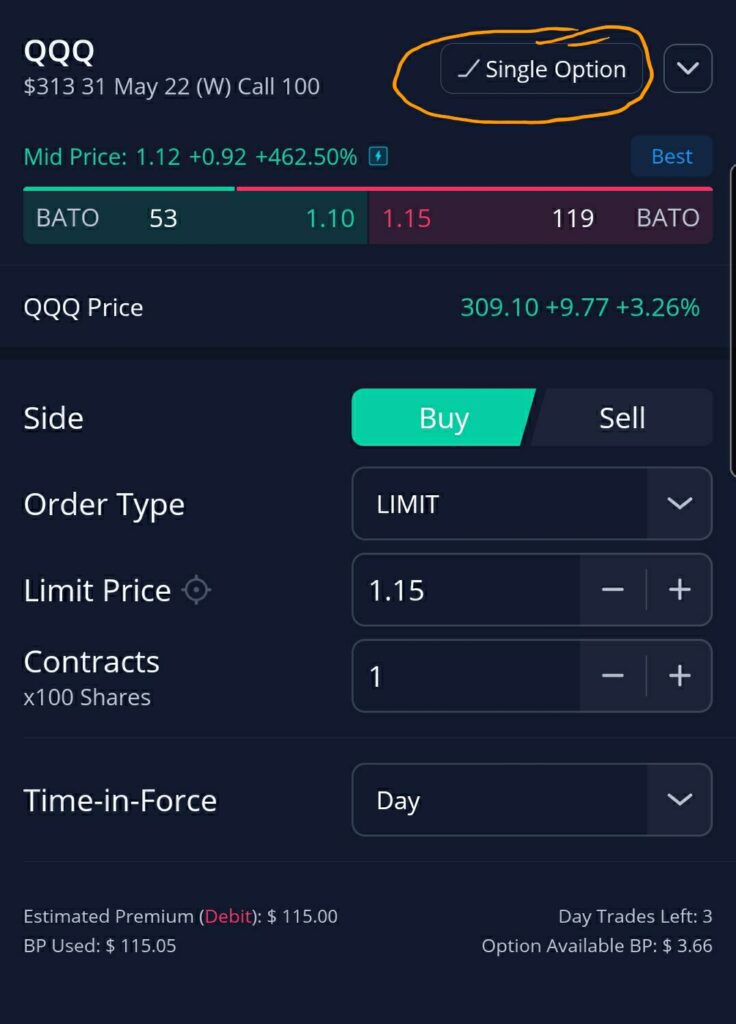
4. Click on the Buy on the Top Left to Unveil your option chart

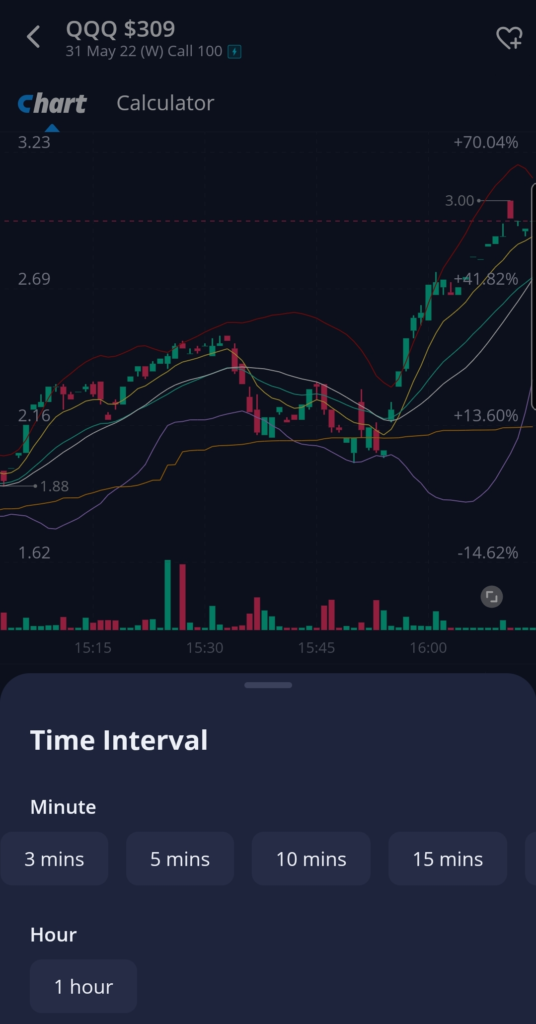
From there, you can select the timeframe of your option chart as depicted earlier.
Also, you now have the ability to access the Webull Options Calculator.
How To Read Webull Options Charts
At the bottom of the Option chart, Webull provides the time and sales for that option.
this means that you have access to LEvel-2 option data.
This is different from the stock Level-2 data we discussed in a previous tutorial.
Webull App Options Time and Sales
The access to the Time and Sales of Option can get a trader into an option trade by identifying how other traders are managing that specific strike price.
Alternatives to Webull Options Charts
Webull options trading platform has really improved since 2019.
The company has been celebrating its fourth-year anniversary during the month of May 2022.

As someone who has been following Webull progress during this time, I can certainly applaud their commitment in providing options traders the resources and tools to become successful.
Can you get Options Charts on TradingView?
As great as Tradingview is for regular stocks charting, it does not yet offer the ability to chart options on its platform.
Hopefully in the near future, such feature might be added.
How To Get Options Charts on ETRADE?
In my YouTube video below, I explain how easy it is to get an option chart on ETRADE.
You will quickly learn how to set up your Option charts with all of your favorite indicators.
You will only need to do it once.
Then every subsequent time, the same indicators will display regardless of the stock option you are charting.
This is a very powerful way to track the evolution of the exact instrument you are trading vs the stock price chart which is just a “lousy” proxy at best.
Below is the Video that describes the easy steps on how to read Webull option charts.
FINAL THOUGHTS ON WEBULL OPTIONS CHARTS
I showed you how to take full advantage of Webull Options charts in 2022 and beyond.
Webull platform continues to set the standard for options trading tools.
If they could just manage to provide paper Options Trading soon, then all the other brokers will always come second in comparison.

Hold a Master Degree in Electrical engineering from Texas A&M University.
African born – French Raised and US matured who speak 5 languages.
Active Stock Options Trader and Coach since 2014.
Most Swing Trade weekly Options and Specialize in 10-Baggers !
YouTube Channel: https://www.youtube.com/c/SuccessfulTradings
Other Website: https://237answersblog.com/