If you are new to stocks or options trading, reading stock charts is one of the most intimidating skills to master.
Hopefully, Webull platform introduces very intuitive stock charts.
This easy step by step guide will bring you an in depth view into how to read Webull charts so that you can easily focus on growing your account.
Table of Contents
How To Read Webull Charts | Webull Charts Overview
Whether you are using the Webull App or its desktop version, setting up the Webull charts for stock analysis follows the same steps.
The main difference is that on the mobile App, you will have the luxury to choose between advanced Webull chart and simplified chart.
The simplified chart as its name suggest provides less indicators than the advanced ones.
I am of the mindset to keep the number of indicators quite small on a stock chart.
The reason is because many beginner traders get distracted quite easily with too many indicators.
Despite this approach, I often see many traders confused with my charts on Tradingview which only show a handful of indicators.
How To Access the Webull Chart Setting on the App
In the new Webull App interface, after you select a stock, the first icon on left of the stock chart.
The view below may be different for you the first time if you have not set up your Webull chart settings yet.
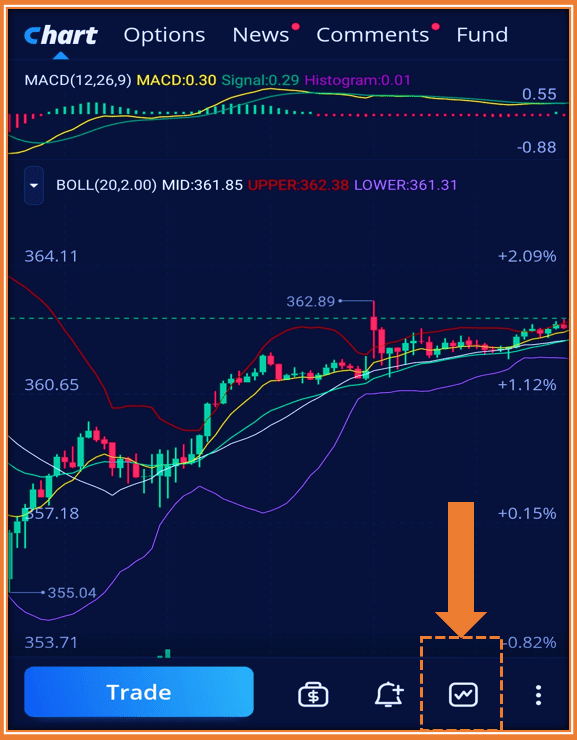
On the bottom right-hand side of the above view, click on the tiny chart icon.
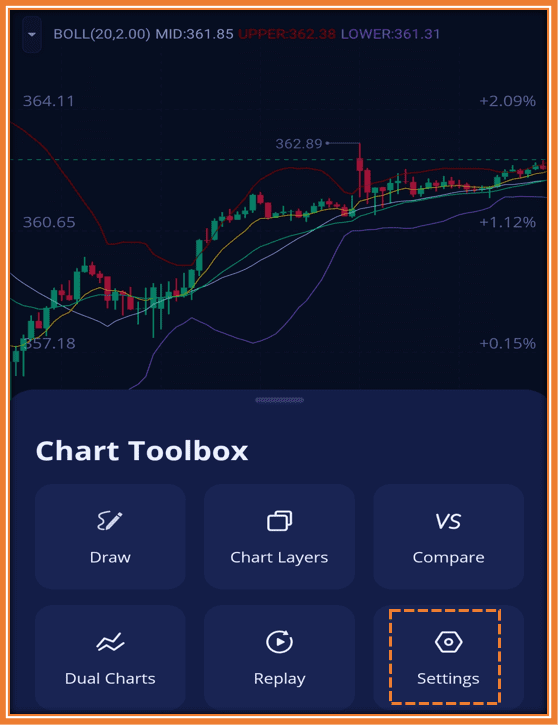
This will take you to a menu similar to the one below.
The displays is the chart Toolbox with multiple menus we will be using later on.
How To Setup Your Webull Charts
Next step is to click on settings to gain access to the chart settings.
On this page, you will be able to easily and quickly select different items.
The first of which is advanced vs simplified chart we introduced earlier.
I am always using the advanced Webull chart.
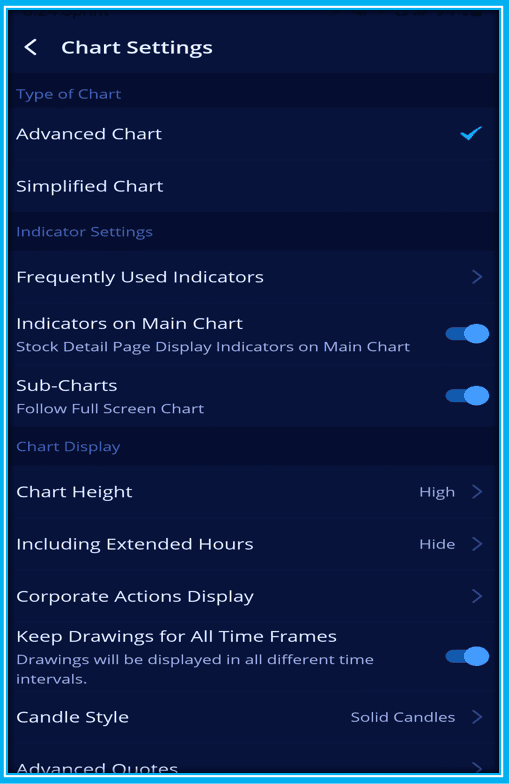
The main items to choose from the menu are as follows:
- Indicators on Main chart: I have this one turned on so that i can see detail about any stock on the main chart
- Sub-Charts: You can determine if you want sub-chart to match the main chart on the full screen
- Chart Height: I selected High because most stocks in 2021 are going up and down
- Including Extended Hours: I am hiding this one because a simple quote reading is enough for me in pre-market.
- Corporate Actions Display: By selecting this, you will be able to see indicators on your charts about Dividends, splits and Earnings.
- Keep Drawings on all Time Frames: you will have the ability to draw on your charts no matter the selection of timeframe
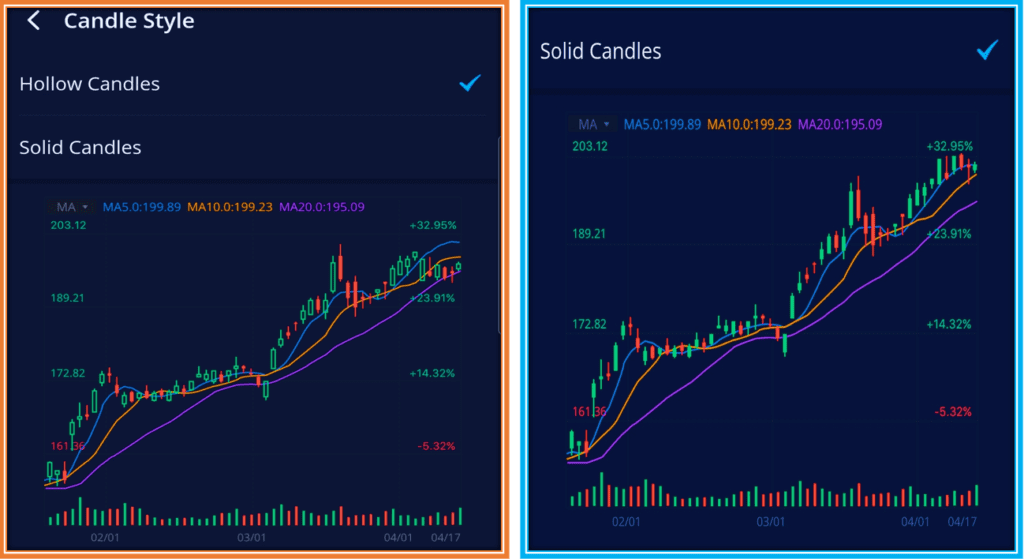
- Candle Style: I always use solid candles in all my charts. The other choice is hollow candles if you would like to try them.
Below is a view of the difference between the hollow candles and the solid candles.
Webull Technical Indicators
If you are into technical analysis, Webull App technical indicators will not disappoint you.
On the contrary, Webull bring a slew of fancy indicators to technical analysis lovers on its main chart as well as on the Sub chart.
Just in case you may be new to stocks charts reading, the main chart is the one with the candlesticks usually on top while the sub charts are below it with key indicators.
Lets explore what is available in each category.
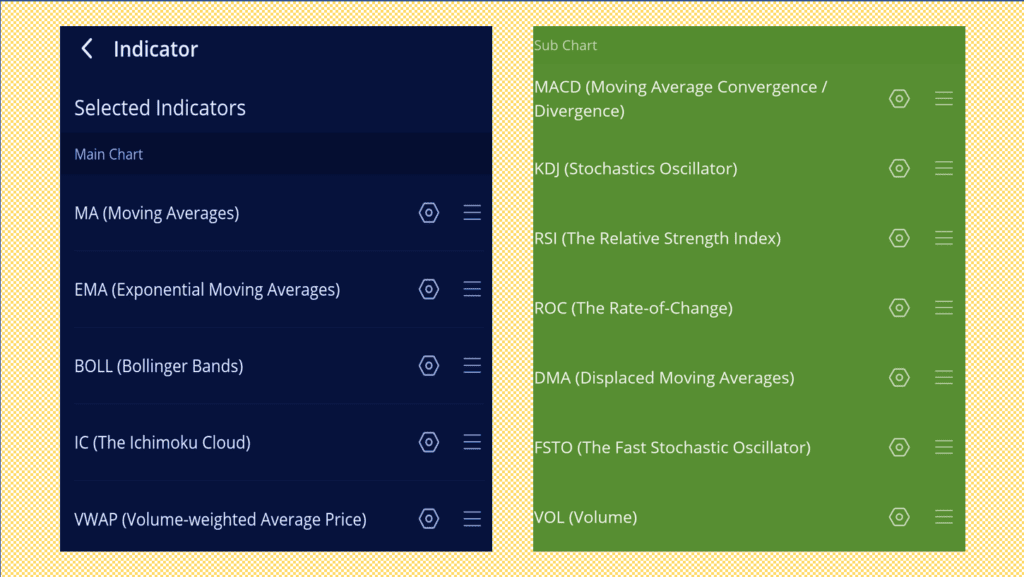
Webull Main Chart Indicators
On my main chart, I like to keep three main indicators.
These are the Exponential Moving Averages or EMA, the Bollinger Bands and the Volume Weighted Average price also known as VWAP.
I know you may have seen other traders use the Simple Moving Averages.
The difference between the two is that the Exponential Moving Average reduce the lag of this indicator by giving more weighting to the most recent prices.
For instance, if we are calculating EMA8, the last 3 candles have more importance than the first five.
A good analogy I like to use when teaching traders is that if you want to know your future, the most recent history (let’s say 3 years or 3 months or 3 days) is more telling than what you did many years ago.
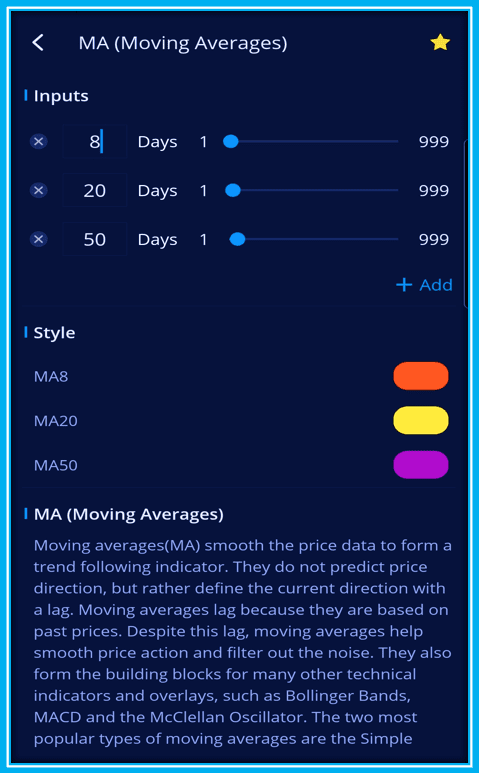
In order to setup your moving averages, just enter the number of periods for each either manually or using the slider as shown above.
Then select your desired color for each.
I like using yellow for my EMA8 and green for my EMA20 in case you were wondering.
Related Video : How Long It Takes To Make 1000% Option Trading Our Gang$Ta Strategy
Why I Use EMA8 and EMA20 on my Webull Chart
I set up all my charts with 2 EMAS: EMA8 and EMA20 meaning the 8-period (understand candles) and 20-period.
This is true regardless of the timeframe at which I am studying the chart.
The reason for this because it helps me identify momentum changes quite easily.
You see the EMA8 is the recent momentum while the EMA20 is the older momentum.
Therefore, the EMA8 direction is always telling me what the immediate future may be.
Hence, when the EMA8 crosses the EMA20 in either the bullish or bearish direction, there is a strong conviction in that direction.
Consequently, we can then trade that direction with great confidence.
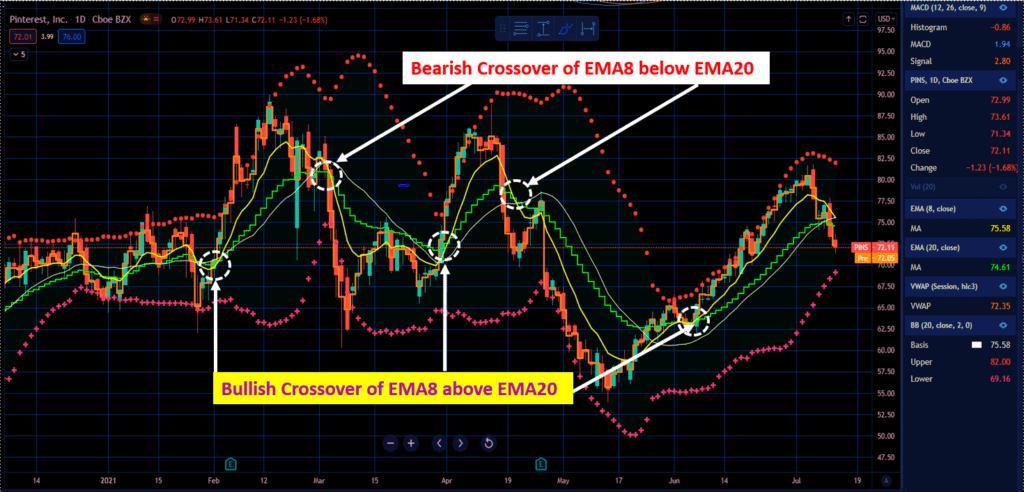
In the above PINS daily chart, I highlighted 5 recent occurrences of EMA8 crossover of EMA20.
Three of such instances were bullish (EMA8 crossing above EMA20) and two were bearish (EMA8 crossing below EMA20).
Should you be wondering how often this happens, the answer is more often that you may think.
This strategy of EMA8 is known as the cross of death (bearish scenario) or the golden cross (bullish scenario).
You can use this in your day trading as well on lower timeframes.
I use the 15 minutes timeframes for day trading.
The only difference is that stocks will tend to have multiple directions throughout an intraday thus several of these crossovers may be false positives.
Here is a nice homework for you.
Please use the Live dynamic chart below to study any stock of your liking and try to identify how many crossovers of EMA8 an EMA20 you could have capitalized on using your new learned trading strategy.
The above chart is interactive so that you can change the stock to analyze.
Modify the styles of the Bollinger Bands and EMAS Lines to match our PINS chart from above.
I provided you a watchlist of stocks the right you can start analyzing today.
Feel free to leave me your comments with the results of your Sandbox experience.
Drawing on Webull Charts
Yes, you can draw on Webull charts and it is quite easy.
The choices range from basic trendline, horizontal , vertical , extended and ray lines.
Patterns and Fibonacci lines are also available.
As you may know from my YouTube videos, those are my personal favorites.
To make it an all-around great experience charting on Webull App, you will be able to add Text annotation to your charts.
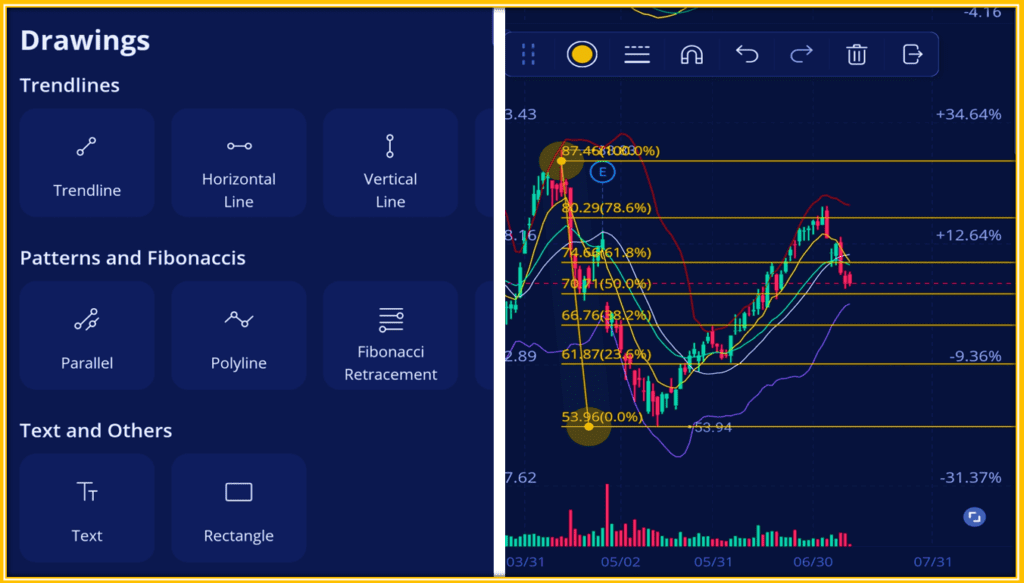
Above you can see the Fibonacci retracement of PINS stock between the High of $87.46 and the Low of $53.94.
How To Include Webull Multiple Chart Layers?
Displaying multiple layers on the charts is a very nice convenience to avoid going back and forth to look for needed information.
To do so, simply select from the view below which layers you would like to see and hide the ones you rather not have on your chart.
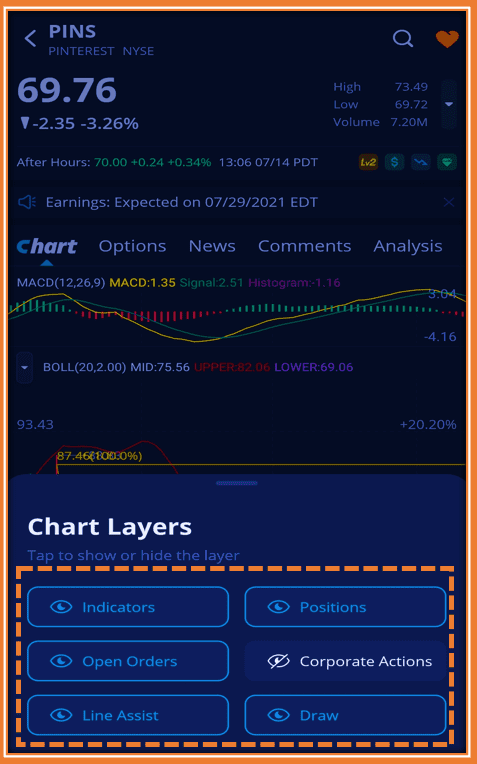
Corporations’ actions are Earnings, Dividends or Investors days when the company is providing updates to analysts.
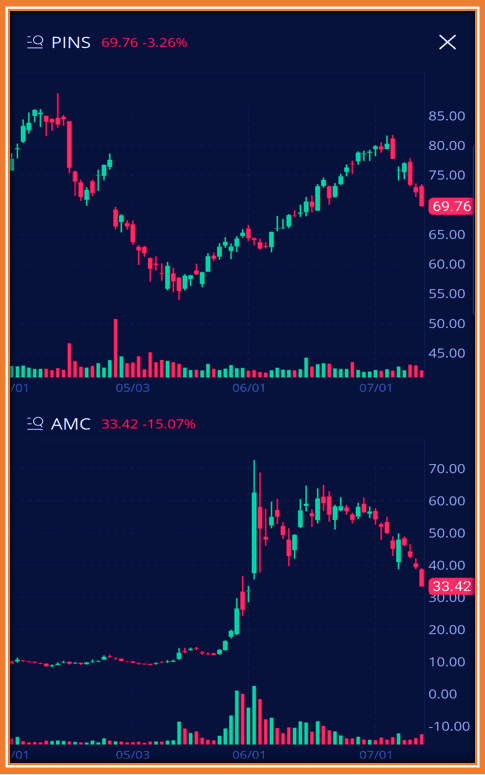
How To Setup Dual Charts On Webull App
Dual charts on Webull provide you will the ability to see two charts simultaneously.
This can be advantageous when trading two stocks and following their progress on their chart.
I used this feature during the writing of this post as I was making nice profit on PINS ( over 100% gain on 71 JUL16’21 71 PUTS) and AMC29 PUTS. These ran from 26 cents to over $1.
Here is the what the dual charts for these two stocks look like on my Webull mobile App.
How To Read Webull Options Charts
If you are an option trader like me, following the options charts is even more important than the stock charts.
What Does Options Chart tell Options Traders
Options track the movement of the specific contract you are trading.
Therefore, what’s better than tracking exactly how that instrument is moving.
Of course, the option chart mirrors the stock charts.
However, there are specific things we can only see on the option charts.
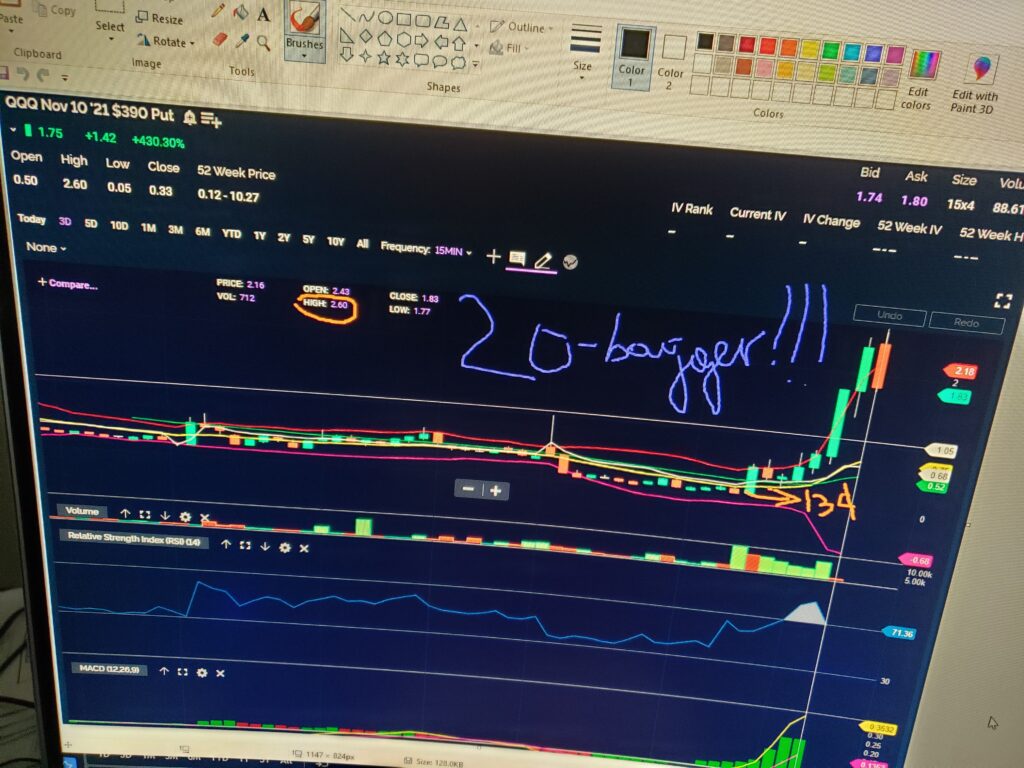
The price of an option contract can increase or decrease because of a spike/decrease in implied volatility while the stock itself is not moving much.
Often, this happens around Earnings date.
Or simply because markets makers are adjusting to overall market conditions.
Track the Contract you are trading
The other major factor that will make options price movement is how many traders are buying those contracts.
In all of these scenario, options traders like you and me cannot get this information by simply looking at the chart of the stock.
Therefore, I teach traders in my Discord room how to read options charts.
You can setup your options charts with the same indicators you already have on your stock chart.
Here is a short tutorial video on how to read options charts on Webull.
Are Webull Stock Charts better than TradingView’s ?
Most brokers do not put enough emphasis on their charts.
I know several ones who leverage the advanced charting capability of TradingView.
Hence the question, how does Webull charts measure the standard?
The Replay Button on Webull Charts
Just the presence of the awesome Replay feature on Webull chart puts its above 99% of the other brokers.
Therefore, Webull Replay matches what TradingView has been providing to traders for years.
One main difference in favor of Webull is that this feature is free whereas you will need a paid version of TradingView to enjoy it.
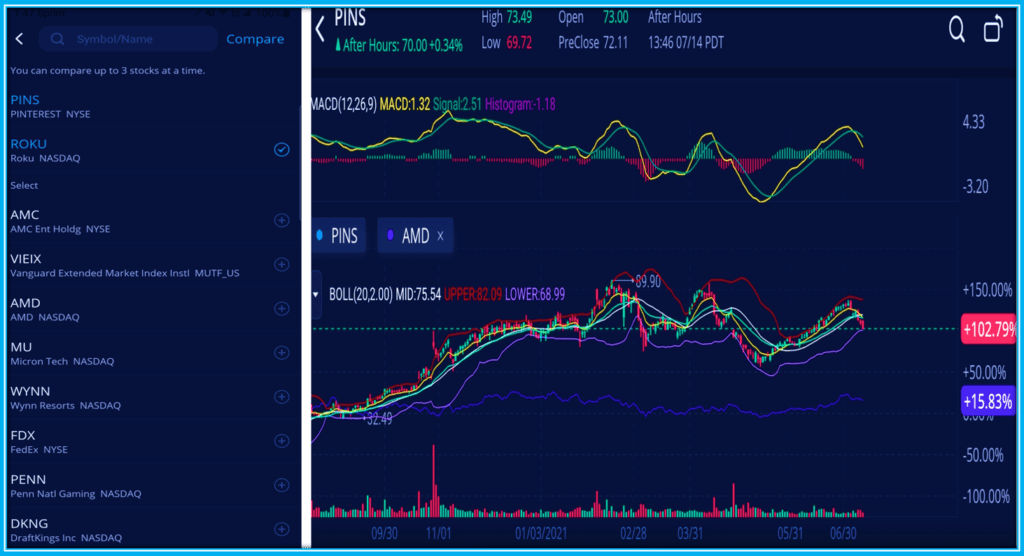
How To Use The Compare Feature on Webull Stock Charts
Not to be outdone by the Tradingview high standard, Webull charts provide you the ability to compare up to three stocks on the same chart.
The reference stock (PINS in the view below) is charted and the compared one moves is shown as a % for the selected time window.
As you move your time window, the reference date change and the % change adjusts automatically.
FINAL THOUGHTS ON WEBULL CHARTS
I shared an in-depth scrutiny on how to use Webull intuitive and innovative charts.
Webull charts keep improving with new features so that traders can make better and effective decisions.
Having the ability to quickly perform technical analysis is key for traders either on the GO or behind their desktop.
If you are Serious about learning how to trade, I can coach you how to read stock charts and successful strategies in 2022 and beyond.
You will be well on your way to get results such as these depicted on my YouTube Channel.
Click on the image below to Learn More.

Hold a Master Degree in Electrical engineering from Texas A&M University.
African born – French Raised and US matured who speak 5 languages.
Active Stock Options Trader and Coach since 2014.
Most Swing Trade weekly Options and Specialize in 10-Baggers !
YouTube Channel: https://www.youtube.com/c/SuccessfulTradings
Other Website: https://237answersblog.com/
