The new Webull Trading App offers plenty on new tools and features to help stocks and options traders.
In this discussion, we will be focusing on How to Use the Webull Volume Analysis feature.
With the intended goal to incorporate this tool into your trading strategy to help grow your account.
Table of Contents
How To Use Webull Volume Analysis | What Is Volume in Stock Trading
Volume in stock trading is the sum of the number of shares sold plus the number of shares bought.
Traders keep a keen eye on this indicator because it can help determine the conviction in either the bullish or bearish direction.
For instance, a stock selling up with high volume will likely attract more sellers and thus the price will likely continue to go down.

The above chart is a very good illustration of how you can use volume as a confirmation of a bullish breakout.
What is Good /Strong Volume
The stock broke out of a two-month range the day after huge volume spike took it out of its previous box.
The following days, WDC stock kept posting higher highs on the daily chart.
In the case of WDC above chart, this coincided with Earnings Release.
However, a volume spike can occur on any type of news. May it be good or bad.
Traders often use Volume in pre-market analysis to help determine the interest in a given stock.
How To Analyze Stock Relative Volume
Relative Volume indicator is a quick way to find out if a stock attracting higher volume.
A strategy can then be established using relative volume which is defined as the current volume divided by the average daily volume.
Values above 0.5 are a good starting point.
How To Use Webull Volume Analysis | How To Read Webull Chart
For a stock or options trader, setting up your chart is one of the most important task.
Because you want to have enough indicators to make a decision on the direction of the stock.
Yet, in my experience, too many indicators can lead to analysis paralysis.
Therefore, we created the video below to help traders create and read Webull trading charts without too many useless indicators.
Four to five indicators should be enough on your Webull chart.
Anything higher and you set yourself up for many dilemmas especially if you are a beginner trader.
Webull Volume Analysis | What is Webull Analysis Tab
When you select a stock on the Webull App, the top view is the chart with your desired indicators as described in the above video.
Then comes a menu from left to right reading | Quotes| News| Comments | Analysis |Press Release | Financials.
Let’s spend some time dissecting the content of the Analysis section.

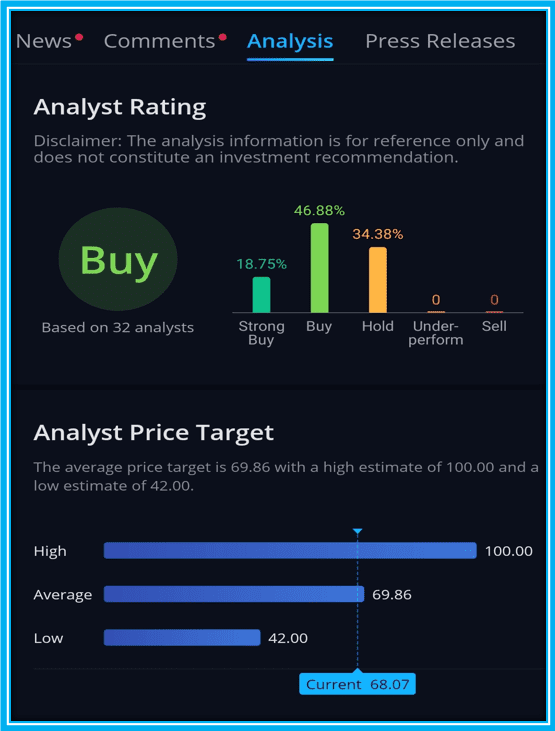
The Usual Analysts Ratings
The Webull Analysis feature starts with the classic Analyst ratings and price targets.
Just like many trading or investing tools, it provides a summary of how analysts think the stock may performing in the near future.
We are all too familiar with this information as depicted in the image below.
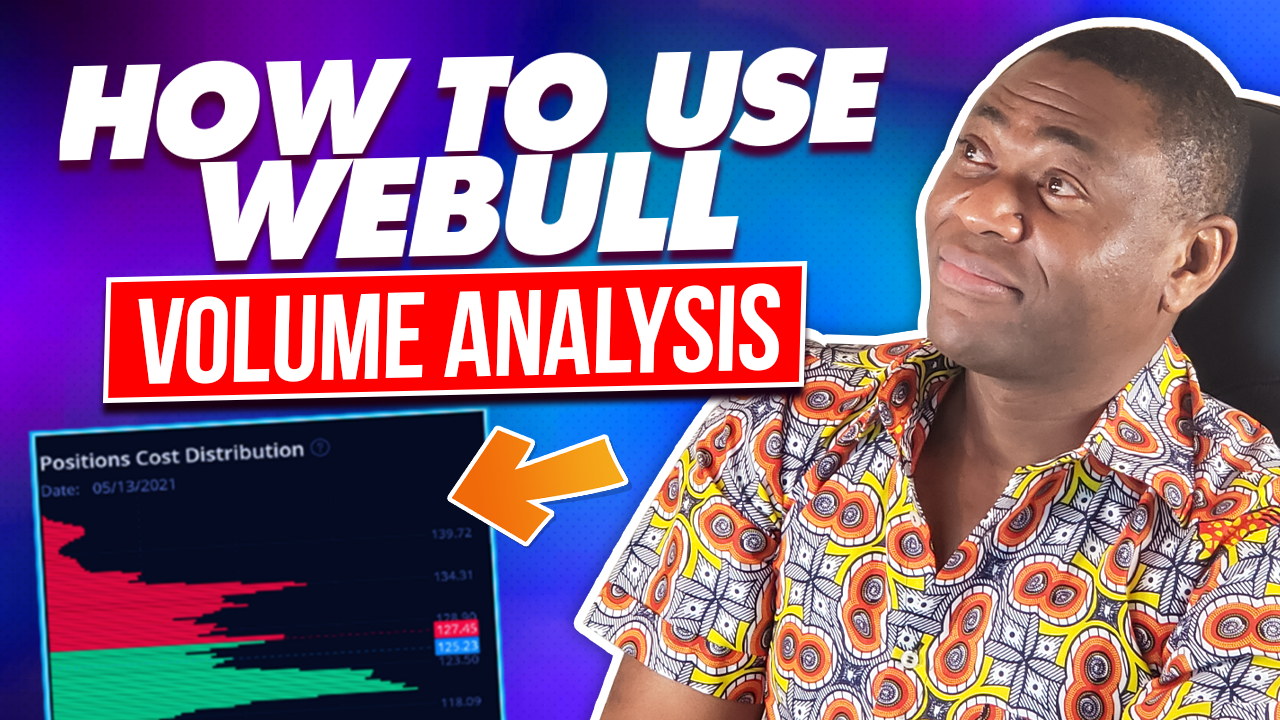
What Is Webull Positions Cost Distribution
Positions Cost Distribution Analysis is fairly new feature on Webull trading platform.
Its provides traders with a way to determine the potential direction of a stock.
In order to understand the concept of Position cost distribution, you need to assume that all the shares are bought and held by the investors.
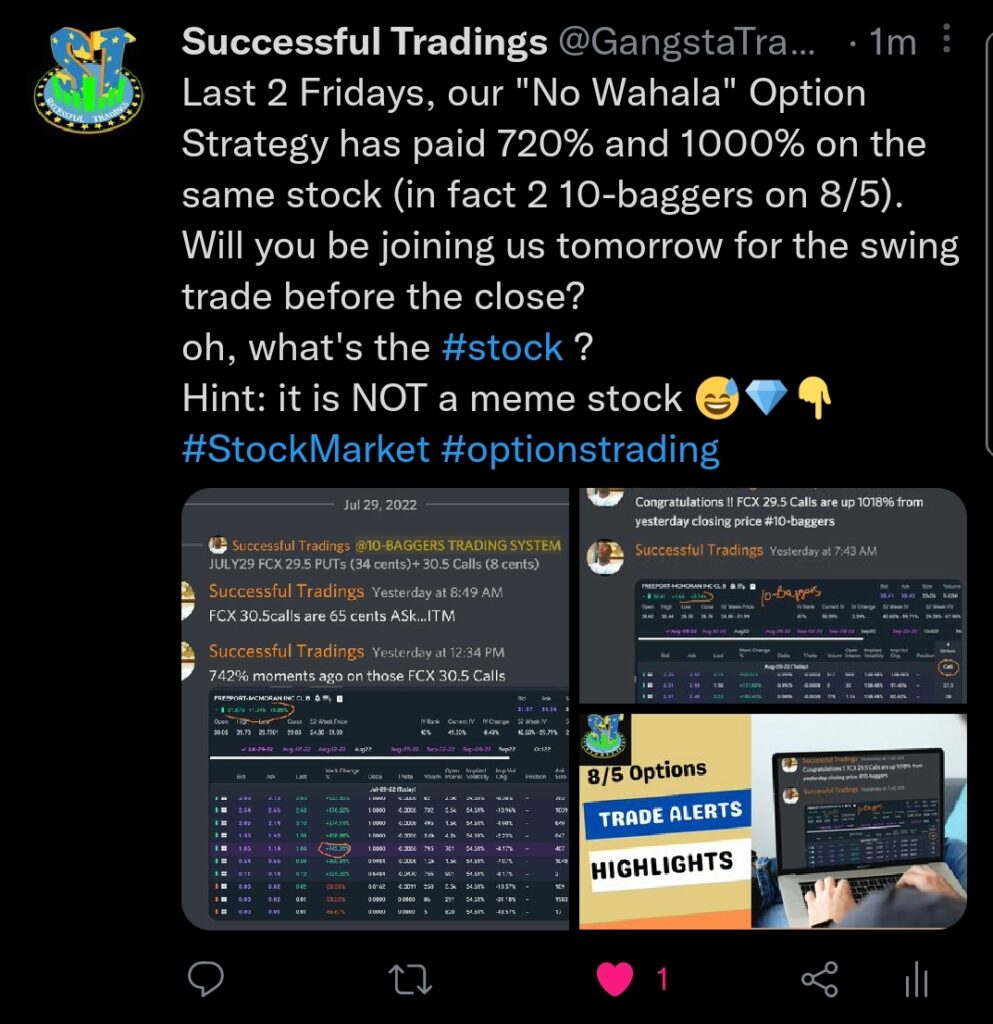
Master Easy yet Profitable Strategies like the “No Wahala” that requires only 5 minutes each week on Thursdays!
The analysis is looking at how many shares were bought at which price level for a given period of time: day, week, month etc.
Assume company XYZ has a float of 1000 shares in total.
Different investors bought all these shares at the price level below:
- 100 shares were bought for $50
- 250 shares were bought for $52
- 450 shares were bought for $55
- 200 shares were bought for $60
This represents the position cost distribution for our example company XYZ.
Profitable Shares at Market Close
Now, we can look at the closing price of the stock to determine the % of profitable shares.
In our example of company XYZ, let’s assume the closing price is $53.
Therefore, we can infer that (100+250) = 350 shares out of the 1000 were profitable at the closing of the market.

This represents 35% of the shares only.
Thus, 65% of the shares have unrealized loss.
We used “unrealized because those shares are still been held by their buyers according to our initial assumption.
How To Use the Position cost Distribution for Short term trading
In general, if a stock price is high and a large ratio of have unrealized losses, there is a high probability the stock will decrease in the short term.
In the above example, 65% of the shares have unrealized profit because the closing price of $53 is well below their buying positions.
Here is the best readout on the concept of Positions Cost Distribution to help understand this new indicator.

As part of positions cost analysis, two other metrics are introduced: namely Cost concentration and profited shares at market close.

What does Webull Positions Cost Distribution Indicator tell You
At the end of the day, as trader or investors, we need tools and indicators to help make investment decision.
Such is the case for the positions Cost distribution Indicator.
Below is the readout with a clear and easy example how you can use Positions Cost Distribution in your trading.

How To Use Webull Volume Analysis in Day Trading
In addition to the Level-2 data provided in the Quotes section inside the Webull App, there is a Volume analysis chart I started using recently.
How To Read Volume Analysis on Webull
The aim of the volume analysis chart below is to help you as a trader understand how and where the money is distributed on the stock you are trading relative to the current price.
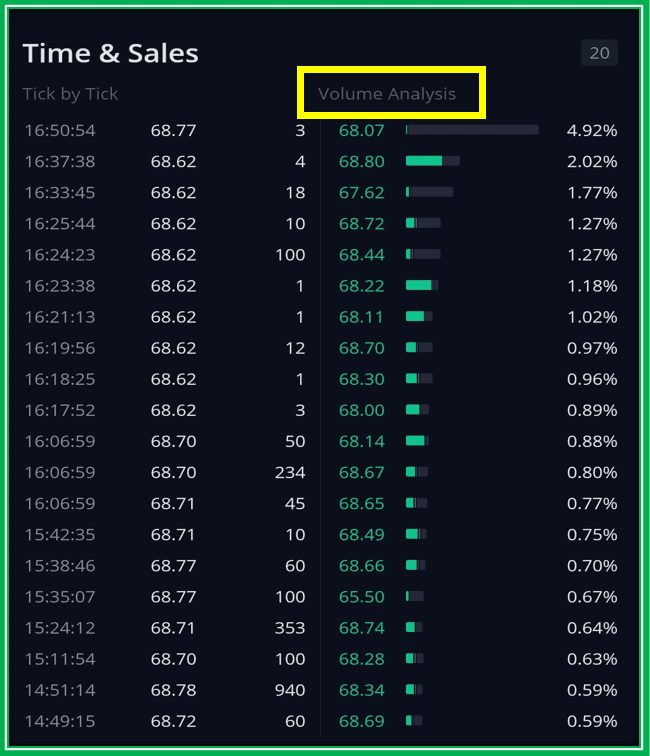
Why is Volume analysis important you may ask?
Because once again, that will help you in determining the direction of the stock.
I used a short and simple video to show exactly how you can use the Webull Volume Analysis feature as part of your day trading.
I was able to read the SPY Volume Analysis on my Webull trading App to set up a very profitable option trade?.
I mostly trade options, so time is always a very important element to consider.
Especially when trading a very volatile instrument such as SPY on Expiration Day.
CONCLUSION | How to Take Your Trading to The Next LEvel
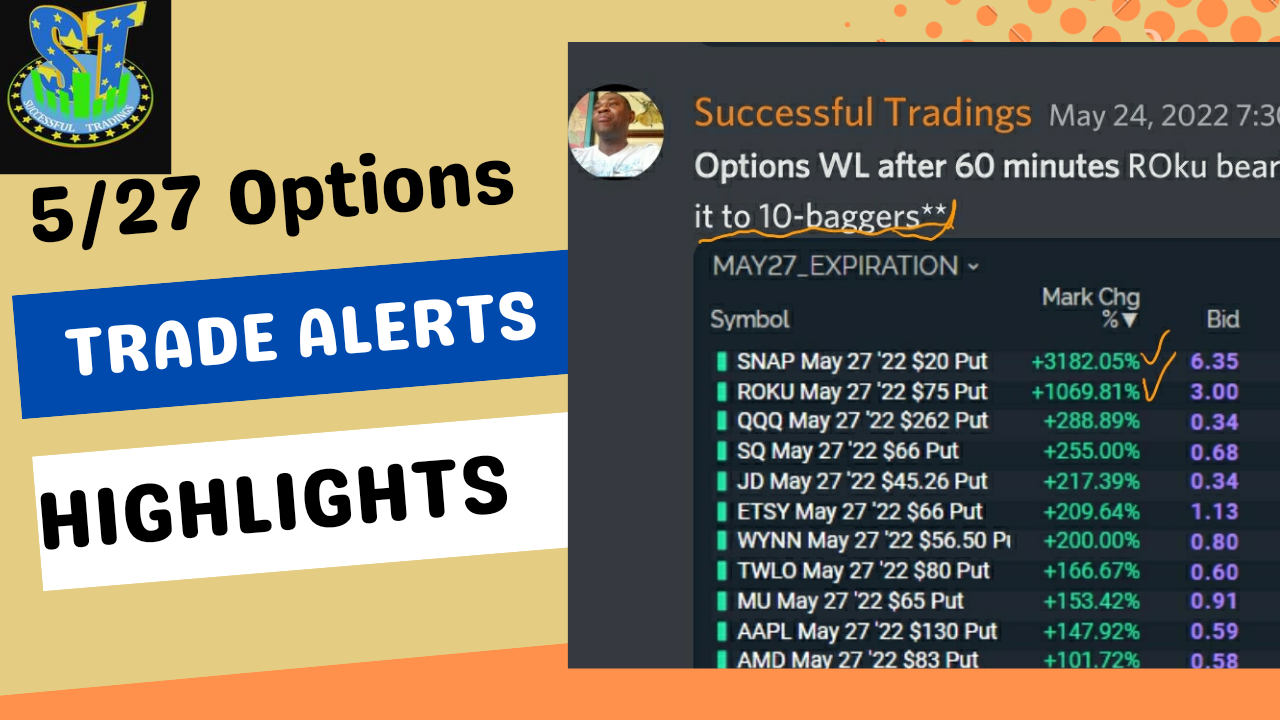
Speaking of SPY strategies, I strongly encourage you to consider checking out proven 10-baggers trading System to help Take your Trading to the Next Level in 2021 and beyond.
Learning How to Trade Options as a beginner does not have to be as complicated as you may have heard. In this step-by-step guide, I will show you how to get started with a very solid foundation on Options trading. Ready to find out about how to trade options like a pro? Let’s get into the details. TelexHold a Master Degree in Electrical engineering from Texas A&M University. African born – French Raised and US matured who speak 5 languages. …
I began trading in 2015 and have been coaching in 2019. This article is from my intensive research and trading this very strategy for big profit. In this Day trading Tutorial, we will share our step-by-step strategies on how we can now day trade QQQ Options for big profit. 2025 Update — QQQ 0DTE Open-Drive Fade Fresh example (Fri Oct 3): 604 Put $0.12 → $2.54 (~+2,016%). Filters refined: gap into daily supply, first 5-min inside bar break, VWAP rejection, …
Still not sure when to trade call vs put option in 20201 ? Look no further. In this tutorial, I will take you through the process on how to make this determination once for all. Through the many examples we have traded, you will discover our secret on how to trade puts vs call options and profit consistently. CALL VS PUT Option | What Are Calls and Puts Before I dive into this discussion on Puts vs Calls option, let …
Hold a Master Degree in Electrical engineering from Texas A&M University.
African born – French Raised and US matured who speak 5 languages.
Active Stock Options Trader and Coach since 2014.
Most Swing Trade weekly Options and Specialize in 10-Baggers !
YouTube Channel: https://www.youtube.com/c/SuccessfulTradings
Other Website: https://237answersblog.com/