Have you ever felt like you are missing out because you do not fully understand the data presented in the spreadsheets?
Well, I have found a tool that will help you analyze information quicker.
We are going to discuss it in this Simply Wall Street Reviews.
Since you will need to consider a lot of metrics that can be daunting and confusing for the novice or even to some advanced traders.
This tool might just be one of the best tools that you will add to your investing arsenal.
Find out in this Simply Wall Street Reviews if it is a trading tool that you would consider subscribing to.
Table of Contents
Simply Wall St Reviews: What is Simply Wall St
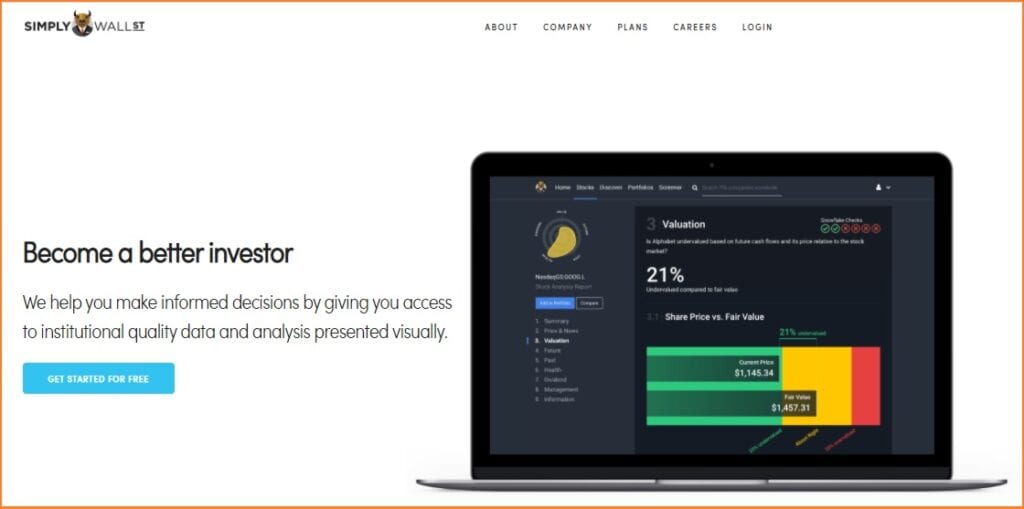
Simply Wall Street is an analysis and data platform designed to aid you in understanding the information of an underlying stock through an infographic form.
This tool promises to help you make informed, unemotional decisions.
Simply Wall St Originality
By giving you access to institutional quality data and analysis presented visually.
Basically, what it does is that it turns complicated financial data into an easy to understand and interactive infographics.
To helps investors identify and assess stocks which meet their investment parameters and objectives.
Here is our Summary video Review of the tool showing all of the inside features.
Simply Wall St Quantitative Analysis
It performs several quantitative checks across a range of assessment criteria and provides the results in Snowflake.
The checks performed are based on widely accepted and tested investment criterias.
Such criteria used by demonstrably successful investors and investment firms.
The checks are divided into five assessment criteria:

Simply Wall Street Reviews: Who Owns Simply Wall Street
Alistar “Al” Bentley is the man behind Simply Wall St which he founded in 2014.
It is an Australian company based at 24 Kippax St, Sydney which later on gained popularity throughout the world.
He is a self-taught investor using Motley Fool and other investing sources.
Then he quickly realized that there was something wrong with the other companies’ business model.
That was when Simply Wall St sprung forth and continued to grow and expand to this day.
How Can You Make Money With Simply Wall Street ?
Since fortunes are made or lost because of information or the lack of it.
You can use the data it provides to identify a stock’s strength and weaknesses.
Snowflake gives you a quick way to get a snapshot of what a company looks like.
Time Saving Reports
The reports will save you hours and hours of research time.
It is important to note that it is not a stock-picking tool.
As such, you cannot just use to blindly invest in stocks that have large Snowflakes.
Simply Wall Street is only a tool to let you better understand the complicated, vast amount of data in an interactive graphical format.
Thus you must still do your own research and understand the company you are investing in.
Simply Wall Street Features
These are the lists of noteworthy features in Simply Wall St:
The Snowflake
It is a visual snapshot of a company that enables you to quickly identify what the company looks like.
The results of the checks in each of the 5 assessment criteria are presented visually in the Snowflake.
It has been to present the results for a company as a visually intuitive summary to allow:
- a quick “eyeball” scan of a particular stock, a group of stocks, or the stock market as a whole;
- visual comparisons of the results of our stock filters;
- side by side comparisons of selected stocks using our “compare” feature;
- consolidated view using our “portfolio” feature.
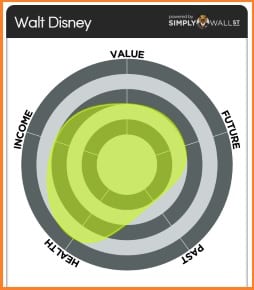
The snowflake is constructed as follows:
Design of the SnowFlake
- For each assessment criteria, there are 6 individual checks performed (giving a total of 30 checks for each stock);
- If a check is successful, it is assigned a score of “1”;
- The total successful checks are added to give an overall score for each assessment criteria.
- for example, a stock may receive 4 successful check scores for “Health”, giving a total Health score of 4 (from a possible 6);
- The total score for each of the assessment criteria is shown on the relevant axis of the snowflake.
How TO Understand the Scores
Total scores for each assessment criteria are then used to generate the shape and color of the snowflake.
The greater the total number of successful checks the larger the snowflake.
Besides, the snowflake is color-coded – the greater the number of successful checks the more green the snowflake.
While the fewer the redder the snowflake will appear.
The size and color of the snowflake broadly indicate the “quality” of the company.
A low score in particular assessment criteria should not necessarily exclude stock from investment consideration.
Visual Summary
The snowflake simply summarizes visually relevant characteristics of a stock.
For example, a low “Dividends” score simply indicates that from a Dividend point of view, the company may be paying a low dividend.
However, it may also be experiencing high growth and reinvesting cash in growth initiatives.
You can still invest in it if you are seeking high growth opportunities stock as an investment candidate.
Discover and Stock Screener

Discover is the easiest way to discover investing ideas in the Simply Wall St’s platform.
They selected pre-made screeners based on what the company believes to be the most popular and widely used screeners.
If you select one of the investing ideas, you will see a list of stocks based on the criteria.
Clicking the Forecast High Growth idea will generate stocks in Snowflake.
Those stocks are the ones analysts expect to have high earnings, revenue or cash flow in the next 3 years.
It uses the future growth criteria of Snowflake.
Simply Wall St Stock Screener
You can further select the whichever market you choose as well as the industry.
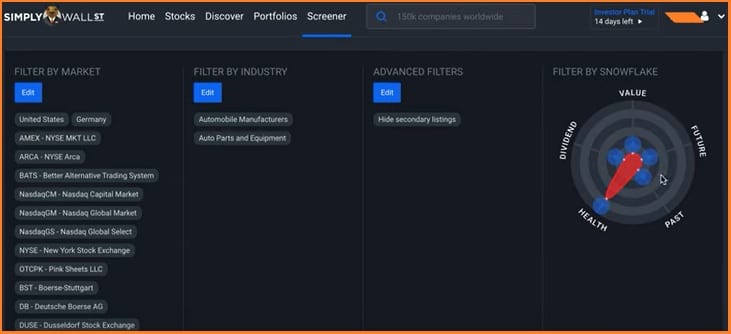
Stock Screener lets you create your own customized screener based on the criteria you are looking for in a stock.
This is a great feature because you can calibrate the screeners to suit your needs.
Or you can drag the filter by Snowflake to whichever criteria you are interested in.
Company Reports
Simply Wall St reanalyzes every company every 24 hours.
It sources data through S&P capital IQ plus analyst who cover the company.
The company reports comprise of the following:
- Executive Summary – a snapshot of all the information and highlights the rewards and risk analysis of the report.
- Share Price and News – in context to the company and the events that have been going on in that company.
- Market Performance – looks into the share price return versus the company industry and the market. This feature will also help you toggle two different types of returns which are the total shareholder’s return which includes dividends and pure capital gain based on the share price.
- Valuation – looks into different aspects of value for the company ie. fair value vs. share price, P/E ratio, PEG ratio, price to book ratio, and next steps which allow you to look for other companies in the same industry.
- Future Growth – this includes a forecast for the company based on the consensus of the analyst estimates on forecast annual earnings growth, forecast annual revenue growth, EPS growth forecast, future return on equity, and next steps
- Past Performance – looks into the performance of the company over the years of its operation which includes earnings and revenue history, past earnings growth analysis, ROE, ROA, ROI, and next steps
- Financial Health – this portion shows the balance sheet of the company and explains if the company is in good financial condition ie. debt to equity history and analysis, balance sheet, and next steps
- Dividend – shows the company’s current dividend yield, reliability, and sustainability ie. upcoming dividend payment, dividend yield vs market and industry, stability and growth of payments, current payout to shareholders, and next steps
- Management – this details how experienced are the management handling the company and do they back up shareholders interest eg the CEO, CEO compensation analysis, leadership team, board members
- Ownership – shows who are the major shareholders and insider trades ie. insider trading volumes, recent insider transactions, ownership breakdown, top 25 shareholders
- Company Information – information such as company bio, employee growth, exchange listings and data sources, location, listings, and company analysis and financial data status
This is very important because by now, you should know that whatever news be it good or bad greatly affects the company’s stocks.
Watchlist and Portfolios
My Watchlist
Two ways in which you can create a watchlist in Simply Wall St.
The first one is making a watchlist from scratch which you can easily add stocks by click on Add to a portfolio.
Alternatively you can search for a specific stock at the bottom.
Linking your watchlist from your broker’s platform is great feature.
The center part of the watchlist is anything that is important that has changed with the stocks in your watchlist.
On the left is the summary of the performance of your watchlist.
Stocks that you have recently viewed and their market performance are on the right side.

Portfolios
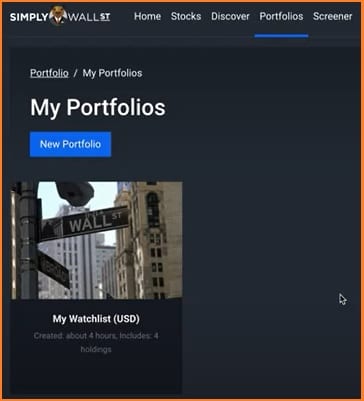
You can create portfolios by clicking on the New Portfolio button.
Also, you can turn your watchlist into your portfolio by adding your holdings and clicking on Edit Portfolio.
This feature includes:
- Executive Summary – includes portfolio Snowflake, which is the weighted average of all the companies in your portfolio.
- Holdings or your stocks in various company
- News on the companies
- Returns – portfolio volatility vs market, historical portfolio value, contributors to returns
- Diversification – diversification by company, diversification across industries which is really powerful if you want to start adding stocks that have different industries in your portfolio
- Valuation – the value of your portfolio based on future cash flows and price relative to the market ie. intrinsic value based on free cash flows, PE ration, PEG ratio, PB ratio
- Future Growth – shows expected growth in revenue and earnings over one to three years which basically means your expected annual earnings growth ie. future growth analysis,
- Past Performance – average performance ratios and growth over the past five years ie. ROE, ROA, and ROCE
- Financial Health – average portfolio debt to equity ratio ignoring financial institutions ie. portfolio debt levels,
- Dividends – average annual dividend yield and top payers which shows what are the companies that pay dividends in your portfolio.
This is by far the best feature of Simply Wall St in my opinion because it breaks down your portfolio into easy-to-digest details which you can further study as it is interactive.
It basically means it shows you how your portfolio is doing .
From there you can look into other means of improving such as diversifying.
Is Simply Wall St Reliable ?
As with every trading tool out there, the reviews are generally mixed but lean on the positive rather than negative comments.
Overall based on our own experience using Simply Wall St, the tool is fully reliable.
Simply Wall Street Social Sentiment
from millenealmoney.com
Simply Wall St. is clearly the best stock data visualization website I have ever seen and I have already spent many hours analyzing stocks that I have previously purchased and a few that I am looking into buying in the near future. As I mentioned before this platform is an exceptional way to browse stocks and I personally recommend it for any investor who wants to experience a new way to look at stock data.
The platform is particularly helpful for new investors with its “beginner mode” and the ability to build and track your own portfolio. I hope you enjoy Simply Wall St. as much as I do.
dying_to_be_vain 2 years ago
No. There was a great post here a few months ago that pulled up Simply Wall Street’s GitHub page, and parsed their valuation algorithm, which is essentially overly simplified DCF models with unrealistic assumptions.
It’s marginally better than other sites, but still a far cry from being worth $10.
Any other information you want can probably be found for free on Yahoo! Finance, Morningstar, or your own brokerage pages – those are my three go-to locations.
FinViz is pretty good, too.
Portfolio Visualizer is great for quick and dirty backtesting.
And of course, SEC’s EDGAR is the most accurate for information but takes a little elbow grease to go through.
So, you can get lots of great information spending $0 for stock-related information, and think that Simply Wall St. will do far more harm than good for anyone who doesn’t understand their methodology.
mxxiestorc 3 years ago
I like to use it as a “double-check” for a stock that I’m already considering.
The breadth of information in one place is really nice.
Positive Experience with Simply Wall Street
charlessccj51 3 years ago
I like to use them as a double-checking tool to make sure that my analysis is in the realm of other analysts’. It’s a great service for compiling and displaying information, even if the data isn’t always on-point. It’s great for helping with a ballpark estimate and to help justify your valuations…also nicely displays insider trading and compensation info for management.
Infoaddict2012
Garbage. All automated generated articles. I wish there was a way to filter them out of the web!
CarRamRob 9 months ago
Computer-generated garbage. No actual insight. Most of the numbers the are pulled are wrong/not relevant.
Their targets and buy ratings are not chosen by a person or even an intelligent AI, just some teenager code by the looks of it.
Alatrist 7 months ago
I have been using it for about 3 years already, and I cannot complain. I have made all my investments based on their numbers and my portfolio has been increasing its value during this time, so I guess the information is most of the time reliable. Of course, the stock market has its own plans and things can change, but so far I don’t have any complaints.
One of the things I like the most is that I don’t have to worry about entering the dividends information. It automatically adds it to my earnings.
What Are Alternatives To Simply Wall Street
One of the biggest competitors of Simply Wall St is Finviz, a research tool for the long term and short-term trades.
In my view, the main differences between the two is that Simply Wall St has a Snowflake indicator.
Simply Wall Street vs. Finviz
This makes the information a little bit easier to digest.
While Finviz uses Map Sections which allows you to see the changes in the global stock market using heat maps and backtesting for trading strategies.
I suggest you read up about Finviz in our Finviz.com Review.
Also there is this comparison between TradingView vs Finviz in Is TradingView or Finviz Best For Option Traders article.
Simply wall street vs Morningstar
Morningstar is long standing reference in the stock market for fundamental analysis.
If you are looking at the breakdown of the financials for a publicly trade company, Morningstar is your platform.
Simply Wall St brings a touch of originality in the manner in which financial data is to be analyzed.
That appeal by itself makes this newcomer worth your consideration.
What I Like About Simply Wall St And What Makes It Stand Out
What I really like about Simply Wall Street is that upon the first view, it is not intimidating at all.
Because it does not contain an overflowing amount of spreadsheets.
Instead, it provides information in a visual way to help you make an informed decision with no bias.
Also, fine-tuning your Snowflake to come up with trading ideas is such a breeze.
And lastly, the way the platform presents your portfolio is something I like.
Since it is not cluttered and gives you the information you need and help you understand what is happening in your portfolio.
What Is the Cost Of Simply Wall St And Does It Have A Free Trial Period
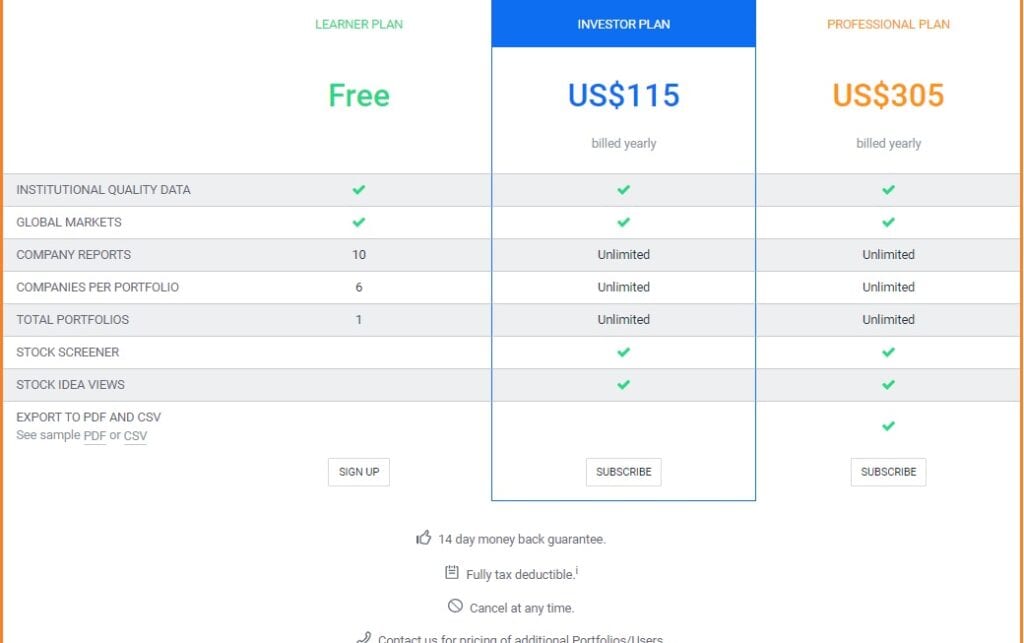
Simply Wall St has a Learner Plan that is free, which if you ask me is not a bad thing.
As long as you are okay with the constrictions in company reports, company’s per portfolio, and the only one portfolio.
If you want to get the Investor Plan $115 annually while the Professional Plan is $305 per year.
Should you do decide to subscribe to the paid plans, you have a 14-day money-back guarantee period.
Simply Wall St Refund Policy
It offers a 14 day trial period for all new subscribers after that refund will be at the company’s discretion.

PROS And CONS
Pros
- Easy-to-digest infographic data
- Fair price point and you can get by with the free plan
- Features that are intuitive and can sometimes be fun to use plus a mobile version
- You can compare company reports side by side and quickly understand what’s happening in your portfolio
Cons
- The screeners might be limiting to other investors since criteria are already set in place
- Can sometimes be buggy
- Other tools such as Finviz is more powerful and offers a lot more
Final Thoughts: Is Simply Wall St Worth It?
In this Simply Wall Street Reviews, I can say this is best for traders who are visual learners.
Or for those who want a quick and easy way to understand their stocks or their portfolio.
I personally think that what the platform offers is satisfactory relative to its price.
Being able to effortlessly look at your portfolio without having to hunker down is great.
Just like going through pages and pages of spreadsheets is an immense bonus, especially to the beginner traders.
But again, advanced traders might find this tool limiting since you cannot add your own criteria.
With that said, Simply Wall St is only a stock research tool.
It is not a service that tells you to buy or sell or hold a stock based on their recommendations.
Meaning, take it with a grain of salt and still do your own research.
Simply Wall St
$115/year vs $305/yearPros
- Easy-to-digest infographic data
- Fair price point and you can get by with the free plan
- Features that are intuitive and can sometimes be fun to use plus a mobile version
- You can compare company reports side by side and quickly understand what’s happening in your portfolio
Cons
- The screeners might be limiting to other investors since criteria are already set in place
- Can sometimes be buggy
- Other tools such as Finviz is more powerful and offers a lot more
