Learning the lingo of stocks and options trading often represents an obstacle for beginners and those looking to jump into trading.
In today’s discussion, we will take you through Online Stock Trading Basics to help overcome that barrier to entry.
Table of Contents
Online Stocks Trading Basics: Bears and Bulls..and Other People from Connecticut
The basic principle of the stock market is that stock prices move strictly based on demand and offer.
Consequently, we can describe the movement of any stock as a tug of war between the bear and the bulls.
Traders who are bullish (the bulls) want the price to go higher.
In contrast, the bears want the price to go lower.
When the bulls are in control, price goes up until it reaches Resistance.
Resistance is a price level at which there are more sellers (bears) than bulls (buyers).
At the resistance level, if the stock does not find enough new buyers then it will retreat back below.
This new phase is often called a retracement.
Let’s take a look at the illustration below of a resistance level.
The chart is from the Investing.com App review we recently shared.

What can we learn from the above chart :
- The resistance price is around 13166.96
- It is a multi-day resistance because the stock could not get above this level on Dec 4 and Dec 5
- I can share with you that this picture is the picture at the close of that market
- Notice the retracement on both Dec 4 and Dec 5: these were opportunities to take a trade
- It will be interesting to see what happens next from this close: this will open an opportunity for a trade
On the other side, when the bears are in control, price goes down until it reaches a support Level.
The support is a price level at which there are more buyers than sellers.
The price will bounce off the support level and retrace upward.
In the chart above, can you identify a support level ? Yes, there is one.
Finally, what makes a support or resistance level a major level is the number of “touches”.
Meaning the number of times the price has touched that level in the past.
These are basic levels traders use to decide their entry into a trade either for an uptrend or a downtrend.
Online Stocks Trading Basics: What Is the Average ?
There are other “natural” levels that traders utilize on a stock charts.
The main ones are the moving averages. Technical analysis tools give traders the options to plot these levels on the charts.
The word moving denotes the fact that a sliding window of a defined number of observations is used.
Every time a new observation is added, the oldest one is removed.
These observations are know as periods.
On a daily chart, A 20-day moving average require 20 days and is equal to the arithmetic average closing price over those 20 days.
If the chart, is a 5 minutes or 15 minutes chart, each observation will be of 5 minutes or 15 minutes duration.
Each trader can define the granularity at which the look at a stock chart.
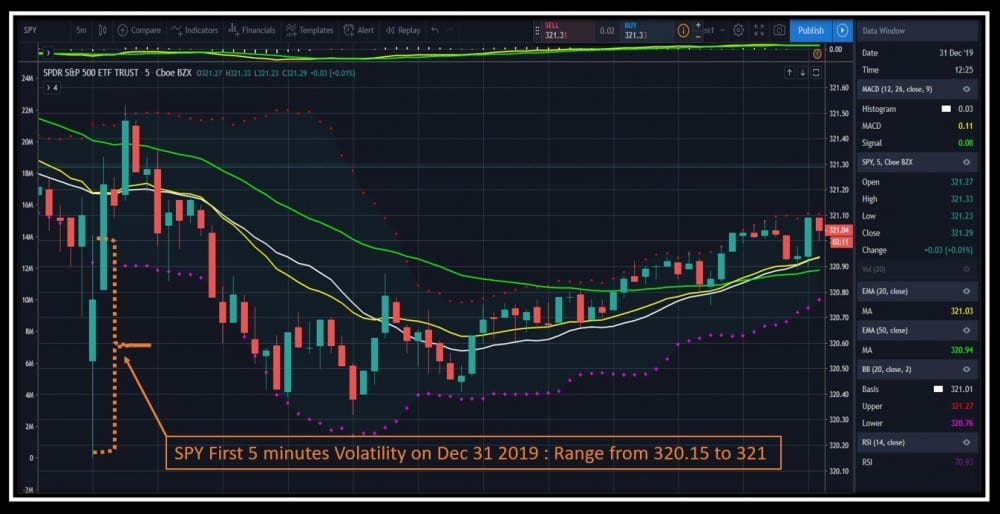
Early in the trading session, I use the 5 minutes granularity and after 30 minutes, I mostly rely on the 15 minutes view.
Depicted above is a 5 minute granularity for SPY ETF.
When unsure about the direction of a stock, it is usually helpful to take a look at multiple time frames or granularity.
Next to the arithmetic average or mean (also know as the Simple Moving average and abbreviated as SMA), there is the Exponential Moving Average or EMA.
The SMA gives the same importance to all the observations while the EMA gives more weight to the most recent observation.
Imagine you are looking at 20 observations of 15 minutes each. This data spans over 20*15 minutes = 300 minutes or 5 hours.
The oldest point in this series will be 5 hours old and may not truly represent the current sentiment on the stock.
Hence, to overcome this, the EMA will give more importance to the most recent data points as they provide fresher information.
It is okay to have both on a chart but on a “fast moving” stock, the EMA is more accurate.
A third alternative to SMA and EMA is VWAP or Volume Weighted Average Price.
VWAP is calculated by weighting each price level with the amount of shares traded a t that level and it is used mostly during intraday trading.
People who uses VWAP the most are Day trader.
We can describe VWAP as the value price.
This means that when the price is below the VWAP, one can consider than the stock is inexpensive or cheap and whenever the stock is trading above the VWAP, it is considered to be expensive.
What I am going to say next is not in contradiction with the previous sentence.
In Day trading, the bullishness of a stock is often measured by its ability to trade above VWAP.
Reciprocally, traders will treat a stock a bearish when its price drops below VWAP.
I have just recently included this indicator in my trading methodology.
So far, I can say that VWAP act as a very strong Support/Resistance depending on the direction of the stock.
To conclude on this indicator, it must be noted VWAP is the same in any time frame: yes, on a 5 minutes, 10 minutes, 15 minutes or an hourly chart, VWAP is identical because it is only a function of the number of shares traded at each price level.
THE BOLLINGER BANDS
There are 4 price levels recorded in financial tools at the end of each trading day.
The Open, the High, the Low, and the Closing prices. You may see them abbreviated in some tools as O, H, L, C.
Studies by John Bollinger have lead to the wide adoption of the Bollinger Bands.
Their aim is to help traders with boundaries on the possible variations of a stock.
There is an upper band, and a lower band. A middle line comes along that is exactly the EMA described above.
The formula for the bands uses a sliding window with a predefined number of observations and a number of standard deviations.
I set my charts for Bollinger (20, 2) meaning 20 observations and 2 standard deviations as shown below.

In this case, the upper limit is defined by EMA20 + 2*Standard_Deviations while the lower case is obtained by calculating EMA20 – 2*Standard_Deviations.
From this, we can tell that the upper and lower band are symmetric in relation to the EMA20.
On most charting tools, you will be given the choice to determine the number of observations and standard deviations.
The naive in me many years ago thought that meant a stock could never trade above its upper band or below its lower band.
Well, it did not take me long before I discovered that not to be true at all.
These bands are merely indicators to help traders see when the price is too stretched to the upside or the downside.
They can effectively be used in entering a trade or exiting a trade.
Traders use the words overbought when the stock price is well above the upper band.
Oversold is the word used when the stock price falls below the lower band.
In general, once the price goes well above the upper Bollinger (regardless of the time frame), there is a high chance it will have to come down a bit before continuing the uptrend.
However, this is not a rule.
OTHER IMPORTANT INDICATORS
Though really secondary indicators in technical analysis, MACD (moving Average Convergence Divergence) is often used to track momentum.
It is a function of the time frame being observed. MACD comes with a signal line that is usually its 9 day EMA.
My experience with this indicator is that it can provide a good indication of direction change in day trending.
To complete this immersion into stock trading lingo, let me leave you with a few terms you may come across.
First ADR and ATR stand for Average Day Range and Average True Range respectively.
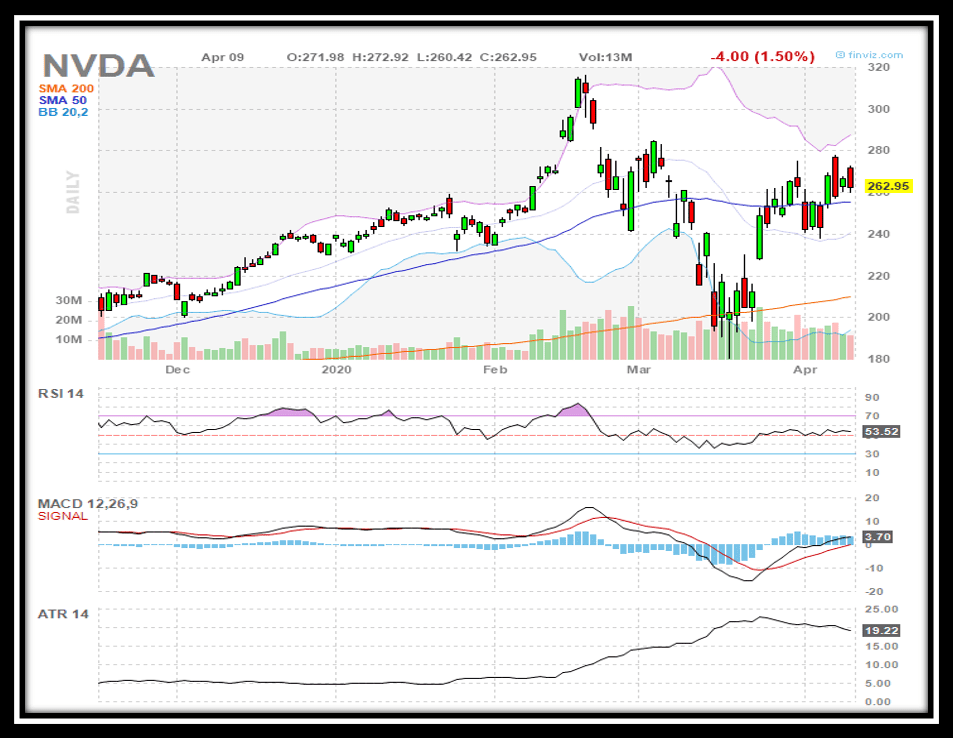
ADR is the average amount in dollars by which a stock moves every day from the Open to the Close.
ATR is the average amount in dollars by which a stock moves every day from previous day close to current Close.
The difference comes from the fact that between the close and the Open, a stock can gap up or gap down.
In the above chart for NVDA stock, the ATR for 14 period has been trending up since mid February from 5 to 20 amid the Corona Virus market selloff.
A gap up is an increase in price outside of the live trading and a gap down is a decrease in price outside of the live trading session.
Both are measured over a given time frame. Thirty, Fifty or 90 days is what I have seen in financial publications.
Why is ADR and ATR important for stock options traders ?
They help traders in selecting the strike price of the options they want to trade.
If we use the Apple chart above, the ATR over the last 50 days is $4.29.
So if you find yourself taking a day trade or swing trade in Apple stock, you can expect a move of about $4.29 in either direction each day.
That is an average which does not mean that the stock will move that much each day.
CONCLUSION
We introduced the concepts of support and resistance and defined natural levels such as SMA, EMA and VWAP.
Other key technical indicators are available to traders to make entry or exit decisions.
We will explore them later on as you continue on this path to Learn to Trade Options.
I shall leave you with this question.
In the first chart we shared depicting support and resistance, the price of that security is over $13,166 !!
What is the name of this stock that is so expensive ?
Leave our answers in the comments section and I will reveal your prize in the next article for all the correct answers.
Suggested Resources
#1 : The #1 Trading Tool You Don’t Want To Miss In 2020
#2: Get Our Free Daily Market Recap Videos on YouTube
#3: What You Need To Get Your Options Trading Career Started

TBP | Becoming A Successful Stocks and Options Trader
Email:Telex@Successfultradings.com
Facebook: facebook.com/telex.tbp.7
Hold a Master Degree in Electrical engineering from Texas A&M University.
African born – French Raised and US matured who speak 5 languages.
Active Stock Options Trader and Coach since 2014.
Most Swing Trade weekly Options and Specialize in 10-Baggers !
YouTube Channel: https://www.youtube.com/c/SuccessfulTradings
Other Website: https://237answersblog.com/
Thanks a lot for such an informative article. I’m one of those people who are beginner with trading options and with a big ambition to learn it. I will share this article with a friend of mine who has more experience and can help me to understand better. Until now, do you think you can help me with a beginner guide or tutorial ? I would like to read all your articles which can bring me to the next level.
Thanks again and keep in touch !
Hello Sir,
Thank you for your request.
We have several post dedicated to beginners that may be of great value to you.
I can think of these immediate two that are logical follow up for you after this one:
Options Trading Explained and Stock options for Dummies.
Hope this helps.
This is nice The stock market is made up of exchanges, like the New York Stock Exchange and the Nasdaq. Stocks are listed on a specific exchange, which brings buyers and sellers together and acts as a market for the shares of those stocks. The exchange tracks the supply and demand — and directly related, the price — of each stock.so therefore for one to be able to partake in something so complex one has to go through the basics and this article has it all.thanks ones again
Hello David,
Absolutely. Getting the fundamentals right through learning the basics is the key to successful tradings.
Thank you for your comment.
Interesting! For such a complex topic, you really break this down in a way I can understand. Every day the stock market drops, it is because more of us are selling than buying. Who are those “extra” sellers selling to?
I don’t understand how this can be. If there is a transaction, there has to be a buyer and a seller. The amount of buying and selling must always be the same. If someone wants to sell and there is no buyer, there is also no transaction.
What am I missing? The security that you mention that is over $13,166, is this the S&P 500? Wal-Mart or Twitter?
Hello Catherine,
Your reasoning is true, for each sale, there has to be a buyer.
However, if buyers are buying at lower prices then the resulting effect is the market dropping.
Sorry, none of your answers is correct. S&P is trading around $3133, Wal-Mart is around $119 and Twitter is only worth 30 bucks.
Here is a hint: I talked about this security in one of my very recent post.
Take Care.about:blank#blocked
Thank you so much for this sensational article about the basics of online stock trading. Its good and helpful that you could share the indicators and the tool that can be used. I’m not really into trading but I have quite some idea about what it really entails. I’ll share to John, my friend, he’s willing to go into trading.
Greetings Wildecoll,
Thank you for forwarding the article to your friend John.
Looking forward to helping John with his future tradings.
Have a great evening.
Trading is very interesting, trust me but it can get all messed up if care is not taken. I like the idea about bear and bull, it makes it really easy to understand the concept of rise and fall. I’ve learned a lot from this article, i wish to make use of this information, I’ll get back to you as soon as am set with it.
Greetings Wildecoll,
Glad to read that you learned a great deal from this post.
Looking forward to answering your upcoming questions.
Thank you.
Oh this is a very good one that has some very good information to match as well because I have a friend who has been thinking of learning all that there is about trading stocks but didn’t know where to start from but with this, I feel he will learn because you have made this one like an interactive class. This is very good. Thanks.
Hello Henderson,
How are you my friend ?
Thank you for leaving us your impressions on this article.
Yes, we absolutely looking to help traders improve their knowledge.
So by interacting with you guys here, we make sure that the content is
tailored to what you need the most.
We appreciate your time and talk to you again soon.