Finviz is a great tool for both fundamental and technical traders.
In this tutorial, we will show you our step-by-step guide on How to Use Finviz for Penny Stocks analysis.
Table of Contents
How To Use Finviz for Penny Stocks | Finviz Overview
Finviz is a web based platform for traders who want to leverage fundamental and technical analysis for help with their investing or trading.
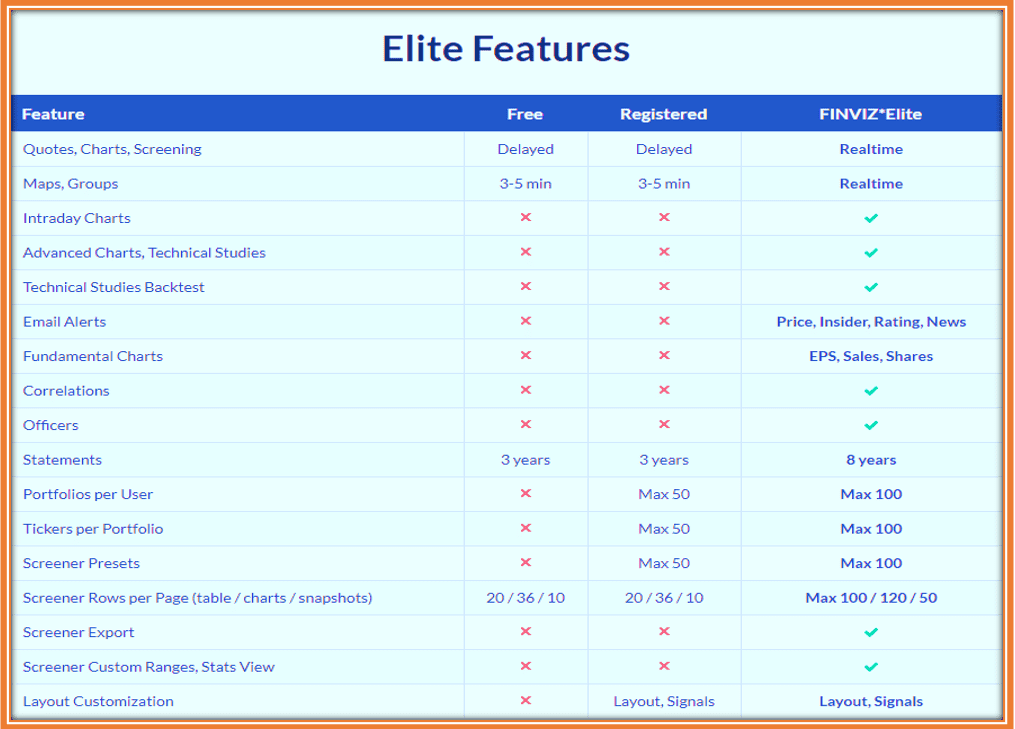
Elite Features
It comes with a free version accessible to all and a paid version know as Finviz Eleite.
One of the main difference between the Free version and Finviz Elite is the ability to have real time streaming quote.
The table below showcases the Free vs The Registered vs the Paid version.
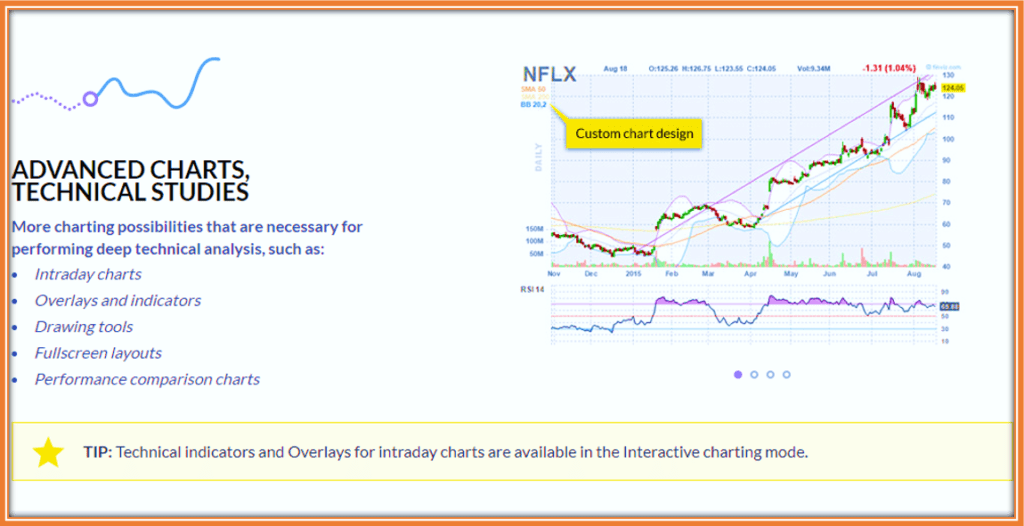
Advanced charts and technical studies are an integral part for any stock and options traders thus making it difficult not to choose the Elite version.
My favorite tool to display multiple charts simultaneously is definitely Finviz.
No matter how complex the study (I mean selection of different filters) you come up with.
Just by the click of a simple button, you will be able to display the output of your research with each stock individual chart within 2 seconds. This is amazing 🙂
Advanced Charts | Technical studies
The other thing I like on the Finviz Elite charts is how easy it allows you to overlay technical indicators. The RSI, MACD or my favorite the Average True Range (ATR) which that our traders leverage to easily compute option strike prices are easily available.
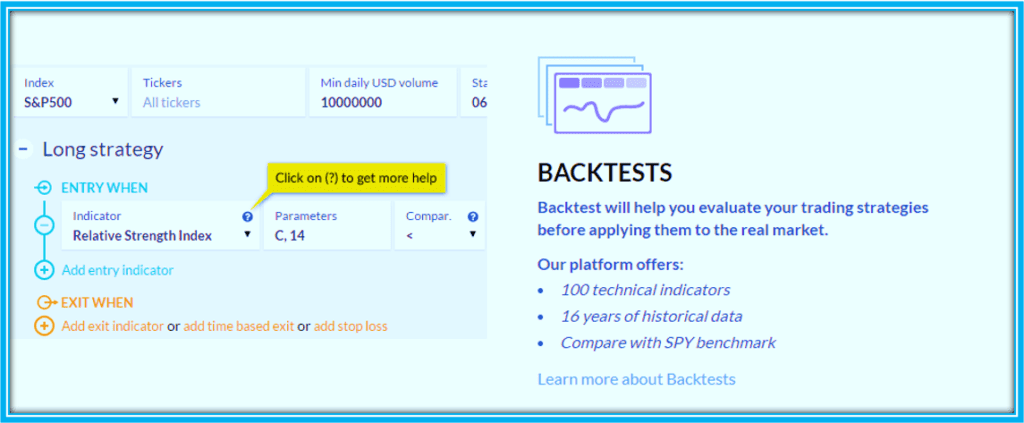
Many traders like validate their strategies before they go live.
Tis can be done on Finviz Elite using the Backtests Feature.
Finviz Elite Backtests
It is a shame that this is not available on the free version but nonetheless this capability really helps traders a great deal.
It brings in the confidence to know how effective your methodology is before you start investing or trading.
We all know that past performance is not indicative of the future performance.
However, when tested over different market conditions (bullish, bearish etc) , any strategy that performs well is more than likely to repeat similar outcome in the future.
You will come to learn that you do not need fancy coding skills to understand and use the Logic of the backtesting feature.
It is written in plain English using the trading parameters most traders are already familiar with.
Correlations
Have you ever been in a trade and started pondering what other instrument trade similar or opposite to the current one you are trading ?
That is exactly the question the automatic correlation will answer for you.
On the top of the table of any stock, Finviz Elite provide a list of stocks and ETFs that correlate positively and negatively with your current selected stock.
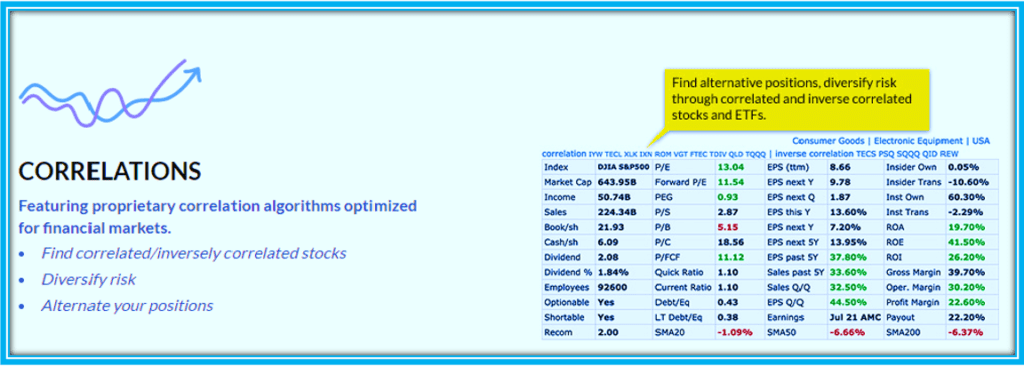
How To Use the Correlation Information ?
Primarily to diversity your Risk by not putting all of the Eggs in the same basket so to speak.
You could also use it to hedge your investments by trading the inversely correlated assets.
For me, I really like to trade several stock options inside of a sector that has momentum to scale up my profit.
One such example that comes to mind is trading WDC and MU simultaneously when both are bullish as depicted in Call vs PUT Option recent Study .
How To Use Finviz For Penny Stocks | Fundamental Analysis Screener
Most investors will benefit from the Finviz Elite Advanced Screener because it enables you to customize your filters based on your own criteria.
Many tools out there have pre-defined settings when it comes to fundamental analysis.
Thus making it very difficult for traders and investors to tailor their research to their specific settings.
Since there are over 7500 stocks to choose from, advanced filtering helps narrow your investments choices to just the ones you can then spend time scrutinizing.
Finviz Elite offers over 30 Fundamental indicators to perform this task within minutes instead of hours or days.

You have access to all fundamental metrics from the classic P/E, EPS, PEG, EPS growth projection (5 years forecast), Free Cash Flow , Operating Income, Debt Ratio to even Institutional Ownership and recent transactions.
This is a full complete view to help narrow your choice to the right stocks for you.
The tool is flexible enough to allow investors and traders to mix and match between fundamental and technical indicators.
How To Use Finviz for Day Trading Penny Stocks
Day traders mainly focus on technical indicators to seek opportunities over a very short period of time.
This is the area we focus on each and every day from the pre-market.
The goal ids to identify stocks that are moving the fastest so that we can leverage of proven winning strategies.
How To Use Finviz For Pre-Market Analysis
Since we mostly trade options, the first filter within the technical analysis tab will be to select Optionable stock.
The second one is the price of the stock.
I like to trade stock worth at least $20 because based on my experience, their options payout tend to be better.
As a matter of fact, should you have the choice, always go for a higher price stock to trade options assuming the Implied volatility is not too high.
Lastly, our third and final filter we lie to use Finviz Elite for Pre-Market Analysis is the Average Daily volume. Typically, I set it to 1 Million Daily shares.

This ensures is that these stock have enough liquidity and thus the spreads (difference between Bid and Ask price) are not too wide.
Options with high Spreads are not fun to trade. They can be difficult to buy and sell when closing your positions .
A good spread is less than 5 cents maybe 10 to 15 cents for the more expensive contract.
As a rule of thumb, the spread divided by the Bid price needs to be lower than 10-15% .
Full Illustration Video on How To Use Finviz for Day Trading
Here is a video on detailing step-by-step on how I use Finviz for Day Trading Options.
We also added a section on how to find and setup Swing trades as we have been getting more questions on this strategy lately.
Here are the Timestamps of the video:
00:00 Intro of the video
01:38 Finviz Screener for Day Trading
03:07 How to trade Gangsta Trade
07:28 Finviz Screener For Swing Trading
11:12 Finviz Screener For Short Squeeze Trading
15:05 #SAVA Stocks
How To Use Finviz for Penny Stocks Analysis
The lure for trading penny comes from the many rags to riches stories out there.
You can imagine anyone’s reaction to reading that it is possible to buy a stock less than ONE Dollar (hence the word penny stock) and turn that investment to $10, $20 , $50 or even $100 per share.
I am not saying that those stories are untrue.
However, we need to be mindful of the odds of such occurrence.
Maybe the percentage are comparable to the number of student athletes who each year turn pro and are able to make a career out of their athletic skills.
High Volume Penny Stocks
We know that Volume is a good catalyst in stock trading.
Consequently, in penny stock trading, it is important to focus on stock with very high volume.
No matter the trading platform you are using, you need to get access to the volume profile.
On Finviz, there are two indicator you can use to screen for high volume.
The first one is the average volume.
This is the daily average volume which can be filtered using a your own customized number like 3 Million shares to narrow down your list.
The relative volume is another volume indicator that can be used by traders to prepare their watchlsit based on pre-market action.
Strong Buy Penny Stocks
One good strategy is you are looking for strong buy penny stock is to use a service like I know First.
They have a package for stock under $5, 10, $20 respectively.
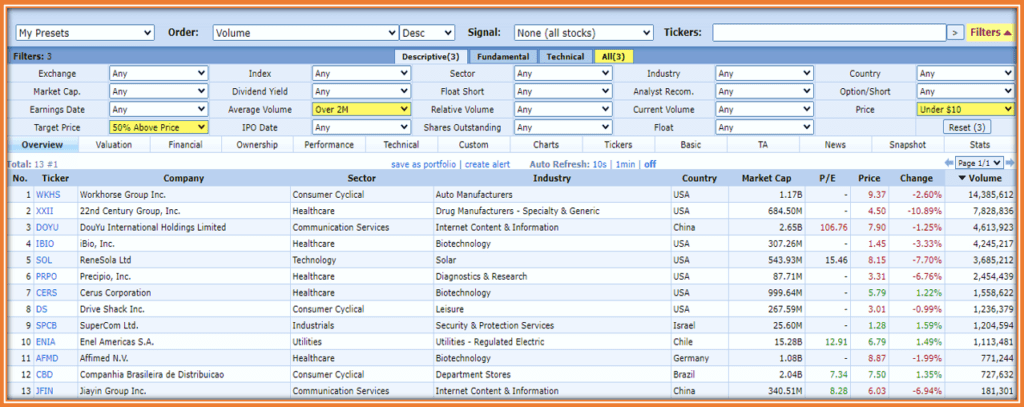
Conversely, you can just create an easy filter on Finviz that look like the one below.
- Price below $15
- Average Daily Volume greater than 2 Million shares
- Target Price : 50% above current price
The above filters lead to the Top 13 High Volume Penny stocks below.
How To create a Penny Stock Watchlist
It is quite easy to create a penny stock watchlist using Finviz screener.
The video below goes in details about setting up a screener for Penny stocks using the Finviz tool.
I believe this can be done even with the free version of Finviz.
Video Timestamps
00:00 Intro of the video
00:55 The Screener Options
02:34 Float and Shares Outstanding
04:35 Relative Volume
06:32 How to short Penny Stocks
07:51 Save the Screen Settings
08:44 Display the Performance
CONCLUSION
While it is certainly possible to make big gains trading penny stocks with Finviz Screener , we would encourage traders to explore stocks options trading as well for consistent big profit.
The key s to find proven strategies that will help you grow your account and Take your Trading to the NExt Level.
Hence, our recommendation is to check out our 10 Baggers Trading System today to start Leveraging our many years of knowledge trading stocks options.

Hold a Master Degree in Electrical engineering from Texas A&M University.
African born – French Raised and US matured who speak 5 languages.
Active Stock Options Trader and Coach since 2014.
Most Swing Trade weekly Options and Specialize in 10-Baggers !
YouTube Channel: https://www.youtube.com/c/SuccessfulTradings
Other Website: https://237answersblog.com/


