While I was doing my usual reading about trading topics online, I came across the term Hammer Stock Pattern.
Apparently, the Hammer Stock Pattern is a pretty standard element in stock charts. In fact, it’s a classic.
But I have to say, it sounds like an unusual way to phrase a term, especially for a very technical market such as trading.
So I was curious and I did my research on what this “pattern” is.
So today I’ll share a little bit about the basics of Hammer Stock Pattern and how to use it to your trading advantage.
Table of Contents
What is Hammer Pattern in stock?
Why a hammer? Does it have anything to do with a literal hammer we use for pounding? Is it like Thor’s mighty hammer?

Well, before I came to understand what that is, I first learned how to read and understand candlestick charts.
A candlestick chart is a style of financial chart used by traders to determine price movements of a security, derivative, or currency based on historical data.
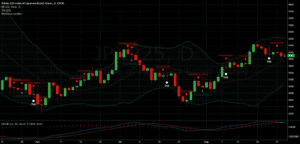
Below is a sample of a candlestick chart on TradingView:

Basically, each “candlestick” shows one day, thus a one-month chart may show the 20 trading days as 20 candlesticks.
When you analyze a candlestick chart, you focus on individual candles, pairs or triplets, to “predict” which direction the stock is going.
Remember the the assumption is that all known information is already reflected in the price.
Now, each candle will tell you about 4 prices: the high, the low, the open and the close.

So when you look at it, each candlestick represents an easy-to-read picture of the price action.
You read candle by looking at the length of the shadows versus the length of the body, as well as whether a candle is bullish (the stock will trend up) or bearish (the stock will trend down).
It can also be used to forecast a “signal” for future price actions.
Here’s a pretty good breakdown on how beginners can master candlestick charts:
Detecting a Hammer Stock Pattern
After I learned about the basics of candlestick chart analysis, I proceeded to dig deeper into patterns.
There are several types of candlesticks that are used in this analysis: dojis, spinning tops, hammers, engulfing candles, pinbars and inside bars and some other variations.
So how do we detect a hammer?
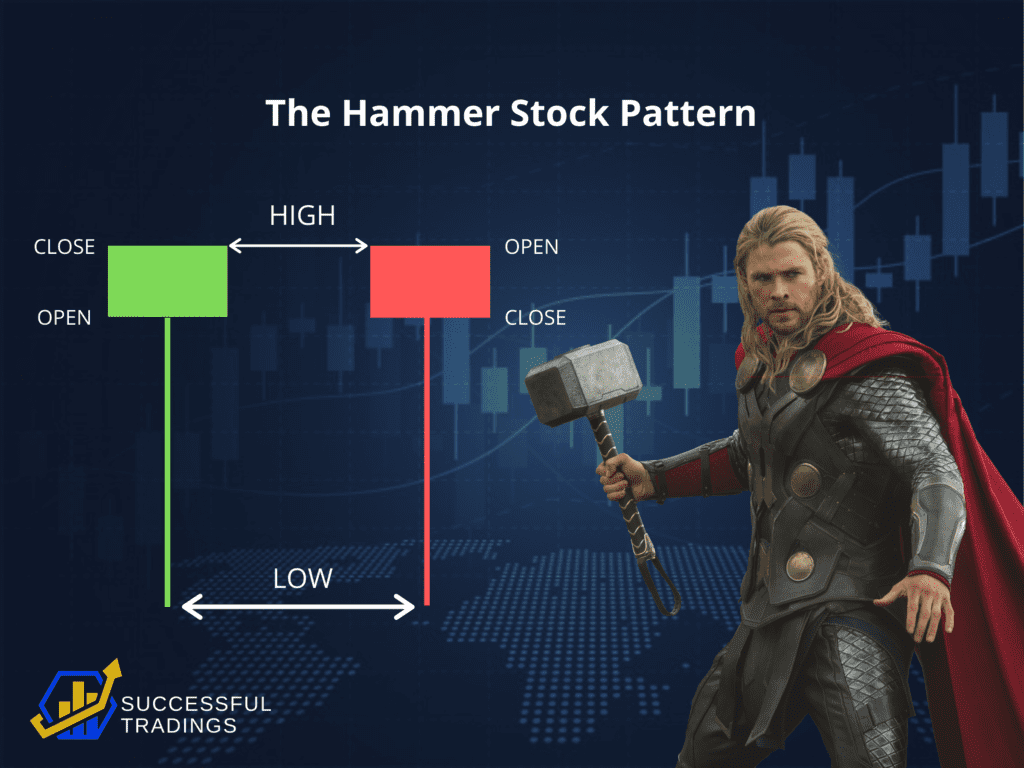
A hammer stock pattern occurs when a security trades significantly lower than its opening, but gains momentum within the period to close somewhere near the opening price.
In the hammer-shaped candlestick, the lower shadow is at least twice the size of the real body.
Is a Hammer Bullish or Bearish?
Wait, what’s with the Bulls and Bears?
Bulls and bears represent a certain stock based on its condition.
Traders use these terms to describe how stock markets are appreciating or depreciating in value.
A bull stock is on the rise and is economically progressing. Meanwhile, a bear stock is receding, where most stocks are declining in value.
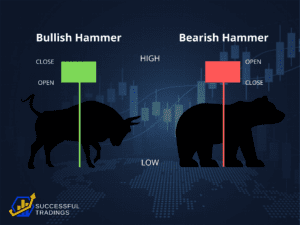
When you look at the hammer and the high and the close are the same, a bullish Hammer candlestick is formed.
That’s considered a stronger pattern. It indicates that the bulls were able to reject the bears completely and push price even more past the opening price.
On the other hand, when the open and high are the same, this Hammer Stock Pattern is considered bearish (or less bullish). This means that the bulls were able to fight off the bears, but were not able to bring the price back to the price at the open.

The long lower shadow of the Hammer means that the market tested to find where support and demand was located.
When the market found the area of support, the lows of the day, bulls began to push prices higher, near the opening price. Thus, the bearish advance downward was rejected by the bulls.
What does a Hammer signify?
Okay so now I have the basics of a candlestick chart and what a hammer is. Now what?
As it turns out, the Hammer Stock Pattern is super helpful in helping traders have a visual of where support and demand is located.
They are the indicator suggesting a shift in bullish/bearish momentum.
So basically, after they see a downtrend, the Hammer Stock Pattern serves a signal to traders that the downtrend could be over and that short positions could potentially be covered.
When a hammer shows up, it will help to either confirm that a potential significant high or low has occurred, which is very crucial information for traders.
Trend Reversals
Because a Hammer Stock Pattern occurs after a security has been declining, it will suggest that the stock is attempting to determine a bottom.
Hammers signal a potential capitulation by sellers to form a bottom, which goes along with a price rise to indicate a potential reversal in price direction.
This happens all during the one period, where the price falls after the open but then regroups to close near the open.
A hammer candlestick does not indicate a price reversal to an upward trend until it is confirmed. This occurs if the candle following the hammer closes above the closing price of the hammer.
What you want to see is a confirmation candle that shows strong buying. Typically, traders will look to enter long positions or exit short positions during or after the confirmation candle.
For traders taking new long positions, a stop loss can be placed below the low of the hammer’s shadow.
Pullback Strategy
The Hammer Stock Pattern has the biggest use when it occurs in a pullback during an uptrend move. It means that buyers are ending their rest and start to buy a stock again.
The pullback strategy expects that the price is going to rise after this single candle pattern occurs at support level.
Trend reversals and pullbacks are two strategies that make use of a Hammer Stock Pattern.
Learn to differentiate the two by watching this video:
To execute the Pullback Strategy, the first step is to recognize the uptrend in monitored ticker or instrument.
The second step is to find a pullback in major uptrend move.
That’s where Hammer Stock patterns come in. Traders will look for bullish stocks with a Hammer Stock Pattern.
To do this, you may need the help of a very good trading service that can search for good trade opportunity efficiently.
Also check: Our comparison review of two popular trading tools.
Lastly, you need to define a good entry point for a bullish trade, the best stop loss level and possible target levels
The Hammer Stock Pattern in Action
We’re conducting a study to test and quantify the effectiveness of this pattern using the most up-to-date data.
We’ll update this section as soon as the results come in!
Some limitations of using a Hammer Stock Pattern
Of course, I came to understand that there is no assurance the price will continue to move to the upside following the confirmation candle.
A hammer with a long shadow coupled with a strong confirmation candle may push the price quite high, typically within two periods.
During this time, it may not be ideal to buy as the stop loss may be a great distance away from the entry point, increasing the risk which really doesn’t justify the potential return.
A Hammer Stock Pattern also doesn’t provide a price target.
That means if you want to figure out what the reward potential for a hammer trade is, you may not be able to get it.
However, there’s still plenty of ways this pattern can help in technical analysis, especially when using it for different kinds of strategies.
What I’ve learned
Hammer Stock Patterns provide huge help in identifying the most advantageous and strategic time to enter a market.
- You can identify a hammer by a candlestick that has a small real body and a long lower shadow.
- Hammers occur after a price downtrend.
- Hammer Stock Patterns show sellers came into the market during the period but by the close the selling had been absorbed and buyers had pushed the price back to near the open.
- The close should be near the open (either above or below) in order for the real body to remain small.
- The lower shadow should be at least two times the height of the real body.
- Hammer candlesticks indicate a potential price reversal to the upside.
- The price must start moving up following the hammer.
- A confirmation occurs if the candle following the hammer closes above the closing price of the hammer.
But I also learned that it’s still wise to check other indicators in conjunction with the Hammer Stock Pattern to determine potential buy signals.
It is always important to get additional information about the stock market by conducting technical analysis.
That’s why in our upcoming articles, we will continue to learn about other concepts in trading analysis to better equip ourselves with knowledge.
Thoughts? Share your comments below!

Hold a Master Degree in Electrical engineering from Texas A&M University.
African born – French Raised and US matured who speak 5 languages.
Active Stock Options Trader and Coach since 2014.
Most Swing Trade weekly Options and Specialize in 10-Baggers !
YouTube Channel: https://www.youtube.com/c/SuccessfulTradings
Other Website: https://237answersblog.com/
You have certainly done diligent research on this topic. As a former forex trader i can safely say that everything you have explained in this article is accurate. I always wanted to try my hand at the stock market, but never got around to actually doing it.
If you haven’t done this already, perhaps you can do an article on Fibonacci and how it’s used to trade.
Hello Oranzo,
Thank you for taking the time to leave us your suggestion about the Fibonacci series and how it is used in stock trading.
We have a full Youtube video on this and recently published this other content titled the Fibonacci Queen Reviews.
Check them out and let us know if they are satisfactory to you.
Talk to you soon.