Following up on my previous discussion, today I’m going to share the basics of the Triple Bottom Stock Pattern.
Just like its top counterpart, the triple Bottom Stock pattern is also a rare occurrence and may take 3-6 months to develop.
Nevertheless, it is one of the most reliable buying signals in the technical analysis of stocks.
We’re going to study how this pattern is formed, what it signifies and how traders can take advantage of it.
Table of Contents
What is Triple Bottom Pattern in Stock Trading?
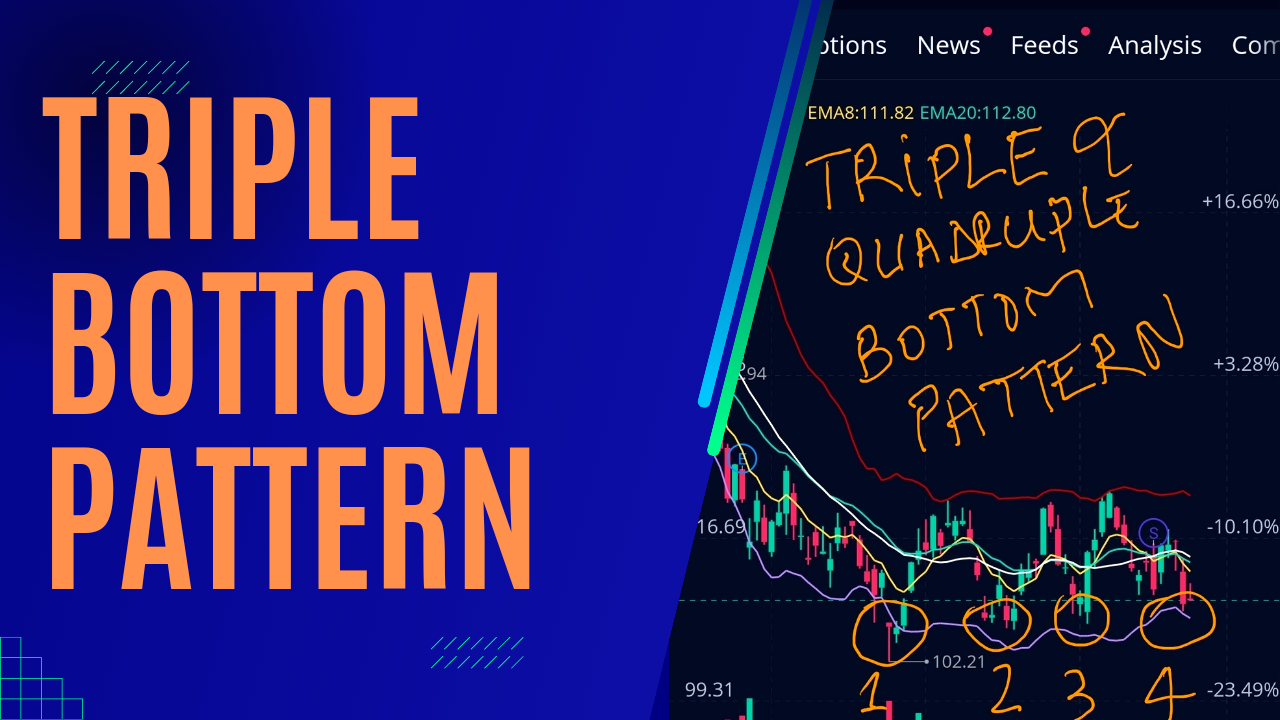
The Triple Bottom Pattern in stock trading is a chart pattern used in technical analysis that’s identified by three equal lows followed by a breakout above the resistance level.
This means there have been three failed attempts at making new lows at the same price level, followed by a price move up through resistance.
Stocks with Triple bottom pattern are often sought by traders who want to trade the bullish reversal.
This trading strategy tends to lead to big upswing momentum that can make a lot of money for traders.
How To Recognize Triple Bottom Stocks?
When you are performing technical analysis on a stock chart on any timeframe, always look left.
By that, I mean look at the past date to see the behavior of the stock or commodity at the current price.
This is very helpful in quantitative analysis.
But also, in identifying when a stock has bottomed out.
You should see that the price has bounced off from the current level it is in.
By that, I mean a reversal in price action has previously taken place at the current level.
This is known as support.
Here is a daily chart of JMIA below to perfectly illustrates this concept.

Example of Triple Bottom Stock | NFLX May 10 to July 10 2022
Here is a chart of Netflix stock with a Triple Bottom Pattern between May 10 and July 10, 2022.
By simply observing this Triple bottom stock, once can understand that it takes time for the Triple bottom pattern to form.
It took 2 months or 60 days for the Triple Bottom pattern to form on NFLX daily chart.

The second observation is the strength of the bullish breakout.
In just 6 trading days, NFLX stock spiked from $170 to $200 albeit aided by a recent Earnings gap.
How To Recognize a Triple Bottom Stock Pattern
You often hear traders say the triple bottom stock pattern a reversal pattern.
The reason for that is because of the trend that has to precede this stock pattern.
So, let’s characterize ALL the telling signs of a Triple bottom pattern.
The Preceding Trend
Before you can ever consider a triple bottom stock pattern, there has to be a downtrend first.
This means that the prior momentum of the stock or asset has to be bearish.
Hence the reversal characterization since the stock will be switching from bearish to bullish.
Then Three Different Lows at the Same Price Level
This second attribute of the tripe bottom pattern is the most important.
Often traders ask me how close in price the three lows have to be.
On a daily chart for instance, those lows have to be within 3-4% of each other.
Depending on the price of the stock, there can be some tolerance to that but for the most part the area of support has to be clearly visible that the stock has bounced there before.
On my above JMIA chart, the $32 level is clearly such level even though each time they price did not exactly bounce off $32 price.
My YouTube Video on Triple Bottom Pattern Recent Examples
Is Volume Important?
Some traders suggest that you ought to see declining volume during the formation of the triple bottom pattern.
Now the one thing I can add here is that the duration of this formation.
In my experience, these three Lows have to take place within 4-5 months otherwise the effectiveness of the reversal will not be that great.
Now let’s address what needs to happen after this setup for you to trade it properly.
Breaking of Prior Resistance
In order to get confirmation of the reversal from bearish to bullish, the stock needs to overcome the prior resistance.
In our JMIA chart, that resistance level is about $42-43.

Prior Resistance Is Now Support
Typically, after breaking above a resistance level, most stocks like to come back and re-test the prior resistance level which acts as a support.
What Price Target To Use
Upon successful re-test of prior resistance level, the target price in a triple bottom pattern is equal to the distance between the resistance and the Lows added to the resistance price.
In the OKTA Triple bottom pattern shown above, that distance between the low ($205) and the resistance is about $25.
The breakout above the resistance around $230 went even higher than the estimated target price = $230 + $25 = $255.
The price went all the way to $275 in just 6 days after breaking the resistance level.
Thus, proving how effective this reversal trade can be when it is successful.
The other thing you have to take from this setup is that over time, you should get to the point where you store this information as an alert.
That way the next time the stock reaches the same level, you will be alerted by your broker or charting tool and you will be ready to make money again.
This is how a Triple Bottom Stock Pattern looks like:

Breakout Defined
Remember when I said that Triple Bottom Stock Patterns consist of three equal lows followed by a breakout above the resistance level? So what is a breakout?
A breakout refers to when the price of a stock moves above a resistance area, or moves below a support area.
Breakouts signify that there’s potential for the price to start trending in the direction of where the breakout happened.
Here’s a quick video of how to detect breakouts in a trading chart:
Is Triple Bottom Pattern a Bullish Signal for the stock?
We’ve already learned previously that a Bullish reversal pattern may form after a market downtrend.
We’ve also learned that Bullish patterns signal a reversal of price movement.
By this definition, we can say that the Triple Bottom Stock Pattern is Bullish, because it tells traders to position for an upcoming upward trend.
What Happens After Triple Bottom Pattern?
As with any reversal pattern, there should be an existing trend to reverse.
And we know that in the case of a Triple Bottom Stock Pattern, a clear downtrend should be the prior formation. So what happens next after that?
Well, as far as volume is concerned, the third low bottom should be on low volume. Meanwhile, the rally up from that bottom should show a noticeable increase.
Here’s a simplified explanation of what goes down when a Triple Bottom Stock Pattern develops:
What does the Triple bottom Stock Pattern Tells You
The Triple Bottom Stock Pattern typically follows a prolonged downtrend where bears are in control of the market.
As I mentioned above, the first bottom could simply be normal price movement.
The second bottom is indicative of the bulls gaining momentum and anticipating a possible reversal.
The third bottom means there’s strong support in place and bears may back down and surrender.
How To Find Triple Bottom Stocks?
The easiest screener to identify Triple bottom Stocks and Triple bottom pattern is on Finviz.
If you just want to filter for triple bottom pattern stocks, go to technical and under the pattern drop down, select “Multiple bottom”.
The view below shows two results as of this writing that meets all these criteria + 3 descriptive I have selected.

Note that there is a separate filter on the pattern drop down menu for double bottom pattern.
The Difference Between a Triple Bottom Pattern and a Triple Top Pattern
In my discussion of the Triple Top Stock Pattern, we know that it is a bearish reversal pattern.
We also know that during a Triple Top, price action bumps off resistance, posting three equal highs before going down through resistance.
That said, the Triple Bottom Stock Pattern is basically a mirror of the same market phenomenon.
Both are about a long contest to gain control between the bears and bulls, wherein one side will eventually emerge triumphant.
If no one wins, a Triple Top or Bottom will simply become a longer-term range.

How To Trade Triple Bottom Pattern?
Now that I understand the concept of the Triple Bottom Pattern, it’s now time to learn how to use it.
First, let’s talk about a Double Bottom.
The price target for a Double Bottom reversal is typically the distance between the lows and the breakout point added to the breakout point.
Stop-loss points (or limits) are usually placed just below the breakout point and/or below the Triple Bottom lows.
Apparently, the Triple Bottom Stock Pattern is similar to the Double Bottom is many ways.
Traders always look for confirmation of a Triple Bottom Pattern using other technical indicators or chart patterns.
Here’s a 3-minute video on the basics of trading a Triple Bottom Stock Pattern:
Taking Advantage of the Triple Bottom Pattern
If you’re a trader and you see a stock has two bottoms, you know an uptrend is coming until the stock reaches the upper support level again.
This is where the pressure is on traders to sell the stock.
A a result, the price will return to the previous low where it’ll hit resistance resulting in the Triple Bottom.
Moving towards the third downtrend, buyers and sellers come together.
However, the lower price increases demand, and the buyers pushed the stock higher, resulting to the final uptrend.
To take advantage, traders will have to watch closely as the price moves higher.
Still, the Triple Bottom pattern can’t be confirmed until the price action trades over the upper support level.
Upon confirmation, the price target can be measured by subtracting the distance between the lows and the upper support level added to the breakout point.
Limitations
Remember, as a trader, you’re working with probability.
That means there is always uncertainty when trading charting patterns.
Just like most patterns, the Triple Bottom is easiest to recognize once the trading opportunity has passed.
Double Bottoms sometimes fail and become a triple bottom.
Meanwhile, the Triple Bottom and another pattern, Head and Shoulders Pattern can, by definition, be one and the same.
But the most known limitation of a Triple Bottom is simply that it is not a great risk and reward tradeoff because of the placement of the target and stop loss.
If you want to maximize the profit potential, you may choose to put your stop loss inside the pattern and trail it up as the breakout occurs.
The issue with this is the likelihood of being stopped out in the range for a small loss is higher.
What are the chart patterns in price action Trading?
Okay, so now I’ve learned the attributes that make a pattern a Triple Bottom Stock Pattern:
- It’s a reversal pattern type
- Prior trend is a downtrend, which makes it Bullish
- All three lows should be equal or close to equal, well-spaced and mark significant turning points
- The confirmation for this pattern is a close above the upper trendline with above-average volume.
- Take the distance between the first high and the low of the head and then add it to the upper resistance level on the breakout.
- The volume tends to be low, heading into the formation and increase on the breakout.

I have also learned that traders should consider a Triple Bottom as a neutral pattern until they can confirm a breakout.
Like the Triple Top Stock Pattern, a Triple Bottom is rare and takes typically three to six months to form.
FINAL THOUGHTS ON TRIPLE BOTTOM PATTERN
The Triple Bottom Stock Pattern is a reliable tool for technical traders. This pattern allows them to find the reversal within the trendline, but also calculate how far that trend will go once it’s there.
It basically tells us the potential for a new trend direction.
And lastly, it helps in signaling a shift in supply and demand of a stock. When timed properly, this creates a great risk-reward trade.
If you would like to leverage our knowledge, take the first step today by making your Appointment online!
With Successful Tradings, you get:
- Free Coaching
- Free Chat Live on our Blog
- Free Daily Alerts on our YouTube Pre-Market Analysis
- Free Option Education on this blog and our YouTube Channel
- Free Interactive Discord Room to Share Ideas with Other Traders
- Our Awesome trade Alerts
- Weekly Videos Performance Review
- Innovative Day Trading Option Strategy – GANG$TA Trades
- Quantitative Earnings Analysis


Hold a Master Degree in Electrical engineering from Texas A&M University.
African born – French Raised and US matured who speak 5 languages.
Active Stock Options Trader and Coach since 2014.
Most Swing Trade weekly Options and Specialize in 10-Baggers !
YouTube Channel: https://www.youtube.com/c/SuccessfulTradings
Other Website: https://237answersblog.com/
I like the way you made this article. Thanks for sharing!