Looking to invest into Qualcomm stock to take advantage of future growth ?
This analysis of Qualcomm stock price predictions will help you leverage what most analysts
are forecasting for QCOM stock in the years ahead.
Additionally, I will share my short-term forecast of Qualcomm stock price so that you can take advantage of the occasional spike in volatility as well.
Qualcomm Stock Price Prediction | Overview
Qualcomm is a wireless technology company located in San Diego, California.
It main business is the development and sales of wireless modems mainly used in cellphones, data centers and other related semiconductors industries.
With the recent advances in 5G technologies, many believes Qualcomm stock is set to grow more than ever before its split in 1999.
After all, the company holds multiple patents in use by the biggest technologies companies such as Apple just to name that one.
QCOM stock price history
Over the last 10 years, QUALCOMM stock has gone from $50 to a recent spike to $188 as shown on the chart below.
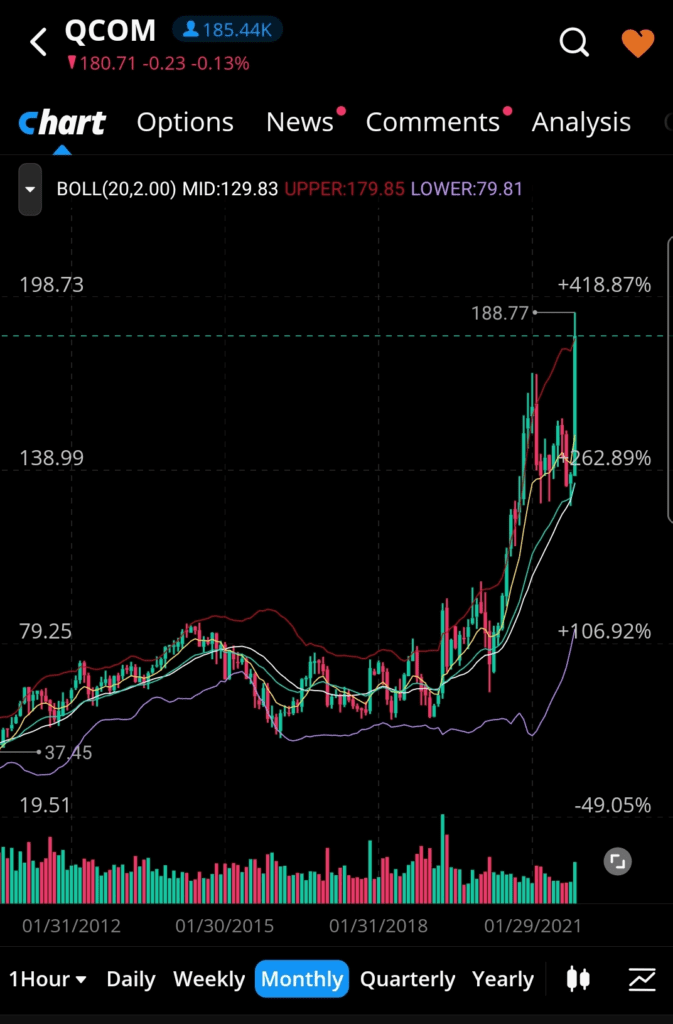
That represents a 276% growth albeit most of this surge has taken place between early 2020 and end of 2021.
Certainly one can argue that QUALCOMM stock price returns in this period are not all that impressive.
However, the company provide a nice quarterly dividend to its shareholders to help offset the timid rise.
At 68 cents per quarter, you as an investor get to receive $2.72 per share each year.
You can decide to re-invest that money in for more shares of QCOM stock.
Who Are Qualcomm Shareholders
The main shareholders for Qualcomm stock are big institutions.
As an investor it is very re-assuring to see such vote of confidence is an established company.
The table below summarizes the big holders of the company stock.
| Entity | % QUALCOMM Shares Owned |
| Institutions | 77% |
| Corporation Itself | 0.03% |
| Others | 23.3% |
| Insiders | 0.11% |
Qualcomm Stock Price Forecast | Analysts Ratings
Out of 36 analysts who have provided ratings for Qualcomm stock price, none of them is recommending to sell this stock.
In fact, here are the bullish view distribution:
- 31% of analysts have a Strong buy Rating
- 42% Have a Buy Rating
- 27% recommend Holding the Stock
Analysts Price Target for Qualcomm Stock
The current price range for QCOM stock price is quite large.
As shown below, the lowest price is at $160 while the highest forecast price is around $393.
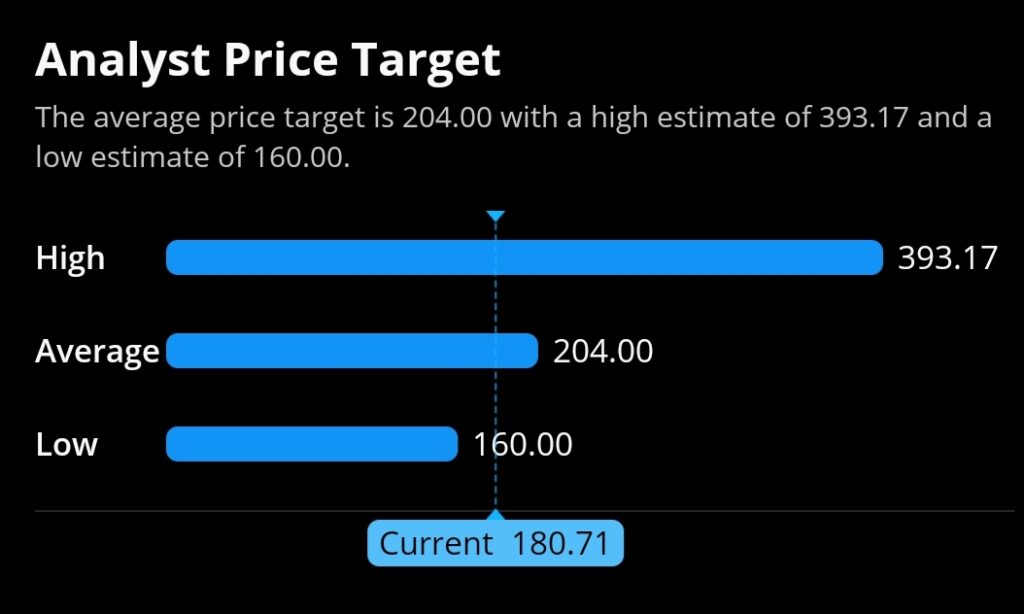
What we can infer from this wide range of price is simple the potential that exits for sustained growth.
My recommendation is to use the positions cost distribution for QUALCOMM stock to get a better idea about the volume distribution.
In this Webull volume Analysis discussion, I shared how you can make usage of this data to gauge the true value of a stock.
Positions Cost Distribution for Qualcomm Stock
The volume distribution for QCOM stock shows that the average cost is around $154.
With that number, we can derive that the distance to the current price of $180 is just shy of 17%.
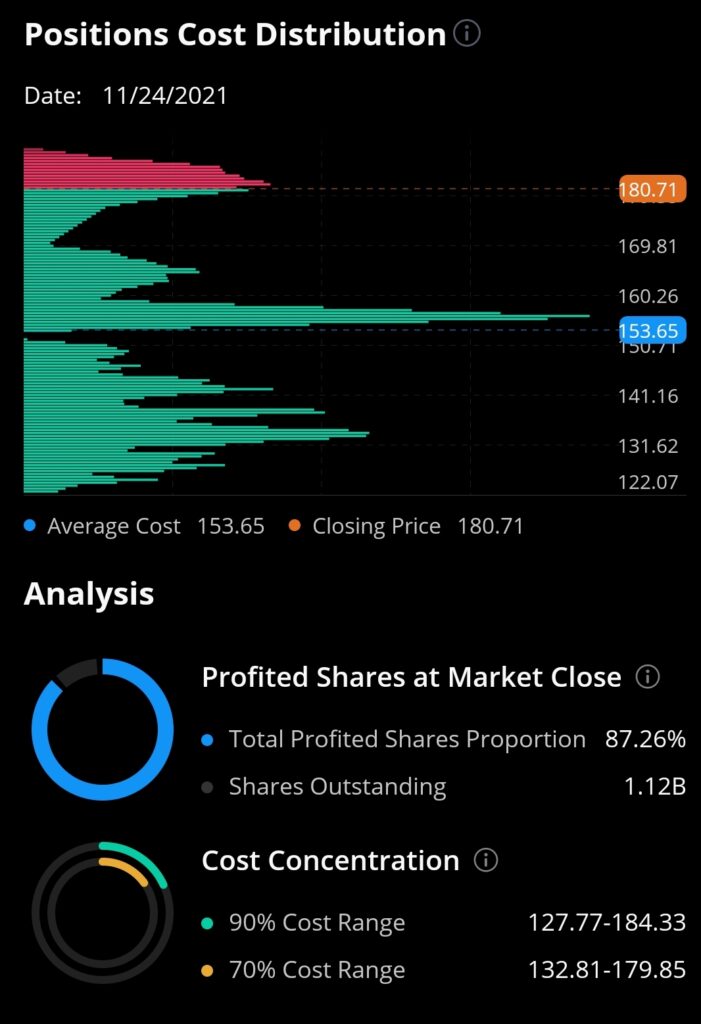
In all fairness, the price at of this writing of $180 is the result of a recent strong Earnings.
May I suggest to wait for QCOM price to come closer to the average cost of $150 range before you start building your long term position based on the forecasted price we shared earlier.
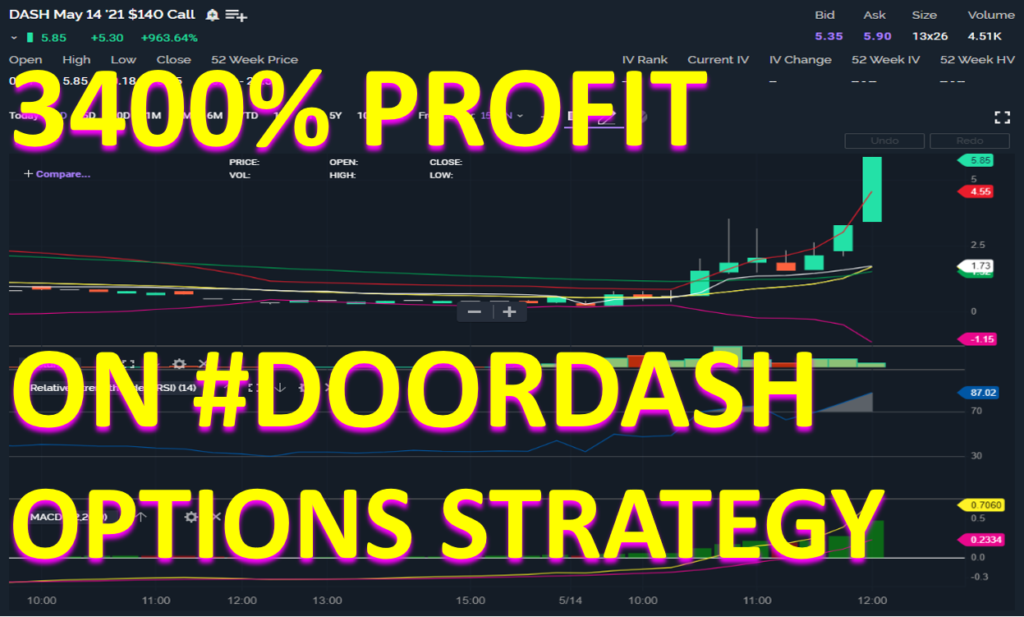
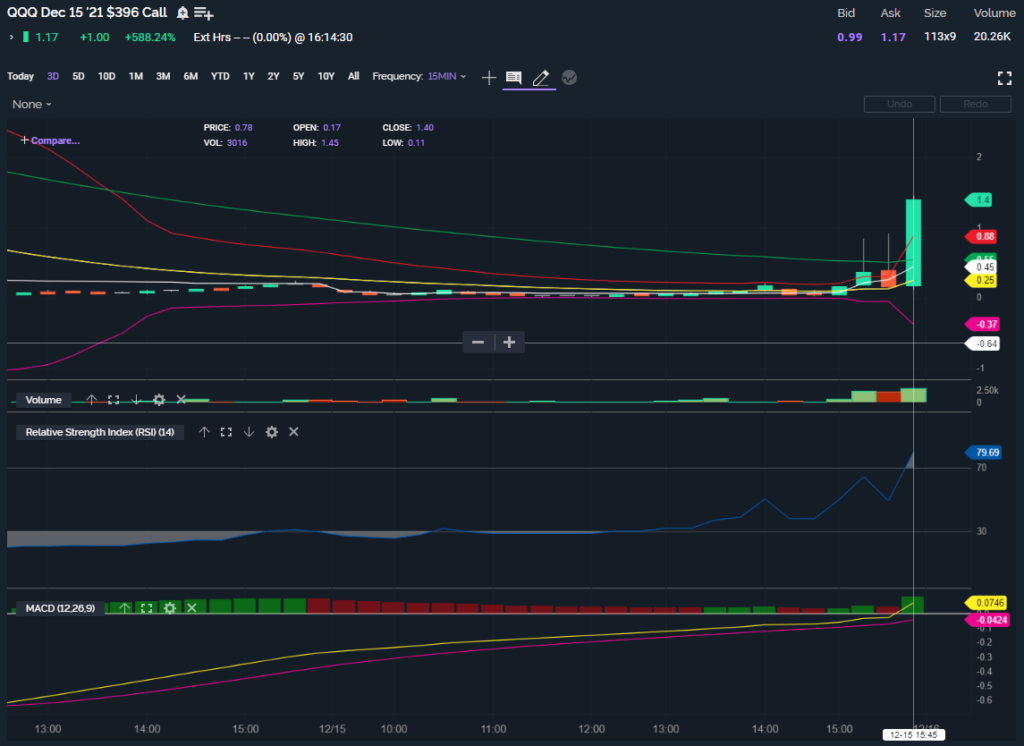
Typically, Qualcomm stock tends to be more volatile following quarterly results as depicted in the video below.
You can take advantage of this volatility by trading options as we did in the video above.
Let me share my Qualcomm stock price forecast around Earnings that enables our traders in our Discord room to generate big profits four times a year.
Qualcomm Stock Price Earnings Forecast
I have studied a basket of about 100 stocks around Earnings each year.
This study includes stocks such as Qualcomm (Ticker: QCOM), AAPL, NVDA, AMD, WDC, MU jsut to name a few.
The output of the research I call Quantitative Earnings Analysis enables me to forecast Qualcomm stock price (and others) on the three days after Earnings.
Multi Years Forecast Study
With the goal to determine if Qualcomm stock make a significant move on the 3 days following each quarterly Earnings, I have studied the pattern of Qualcomm stock on these days since 2017.
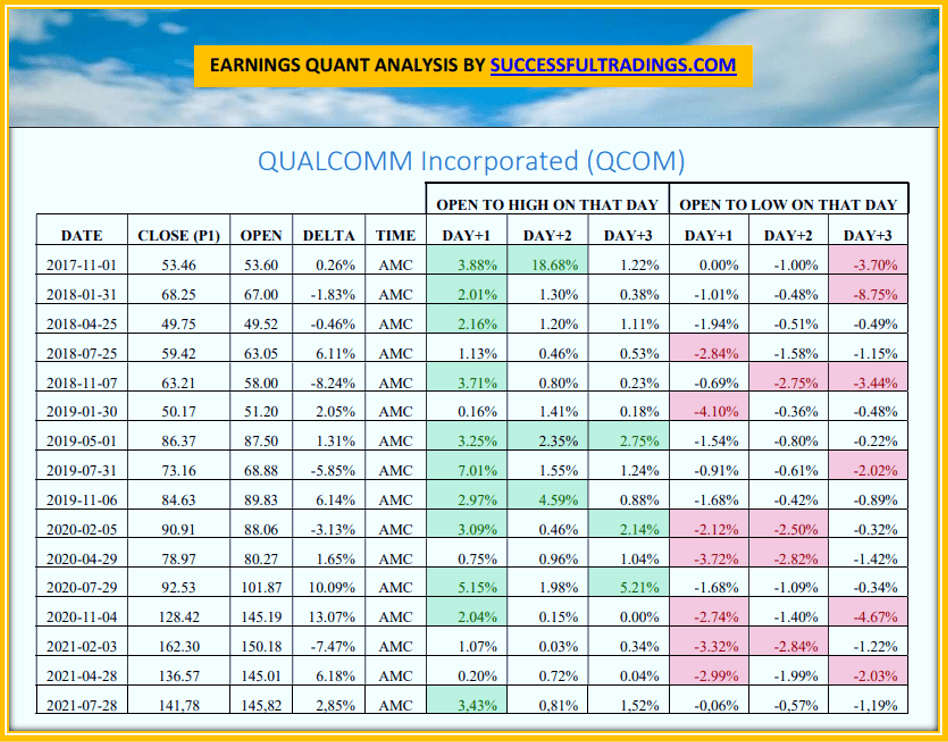
Before we get to dissect the data, let me give you an overview of what the content is about.
For each Earnings date on the far left, I tracked the qualcomm stock closing price on the 3 days following the release of the company Earnings.
The columns in the above table are described below:
- ER DATE: The date of the ER.
- CLOSE (P1): The closing price of a stock before ER.
- OPEN: The opening price of a stock after ER.
- DELTA: The gap between the Close(P1) and OPEN
- TIME: AMC (After Market Close) or BMO (Before Market Open)
- BMO : Before Market Open
- AMC: After Market Close
- DMH: During Market Hours
What does the Qualcomm Earnings Quantitative research tell us?
First thing that jump straight to us is the accelaration of the price since May 2017 Earnings.
QCOM stock price grew from the 50’s to the 80’s in just one Earnings release.
Since then, it has continued to grow with great consistency reaching a recent high of $180 after November 2021 Earnings.
How To Use Qualcomm Stock Price Earnings Forecast
The most important information on the data chart are the cells in green and red.
The color coding is as follows.
Green if the cell is greater than positive 2%
Red if the value of the cell is less than -2%.
The forecast for this Qualcomm stock price is derived from this simple observation.
11 out of 16 Earnings have yielded a green cell on day following Earnings. That is 70% accuracy.
I can add the most recent data point for November 2021 and that qualcomm stock price Earnings volatility forecast increase to 71%.
This forecast is mostly bullish because the red side only has an occurrence of 7times out of 17.
You may be thinking that the average bullish move is 3-4% which may not be much for an average stock buyer.
However, we use this qualcomm stock price forecast to trade options.
As you may know, the advantage of options is that it cost us way less money than the price of the underlying qualcomm stock.
Furthermore, a 3-4% move on the qualcomm stock will yield 200-300% profit trading weekly qualcomm options.
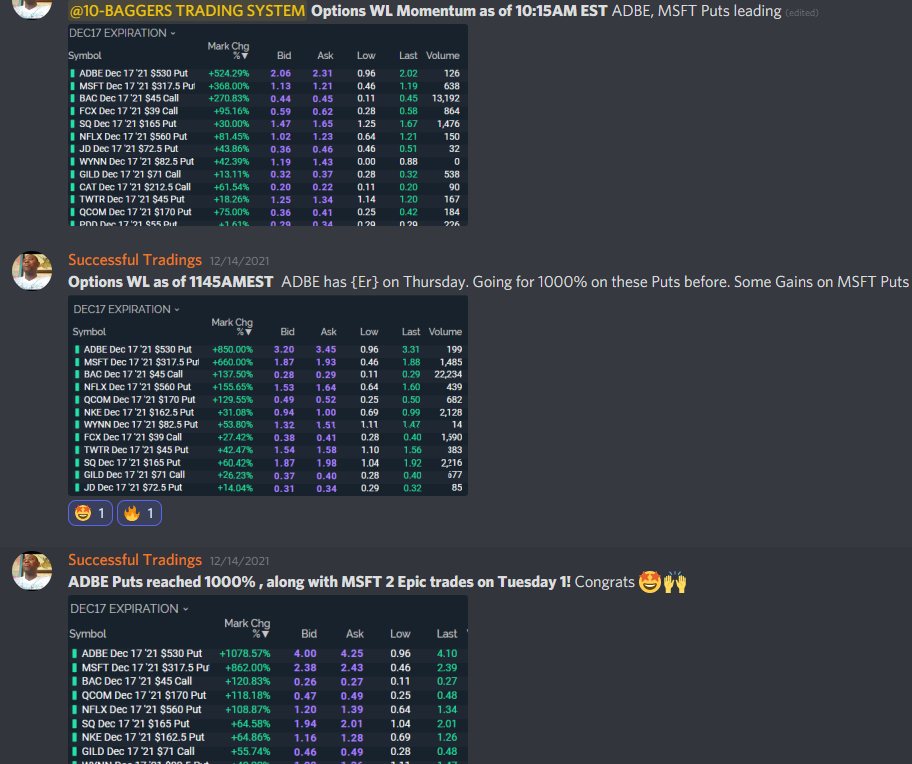
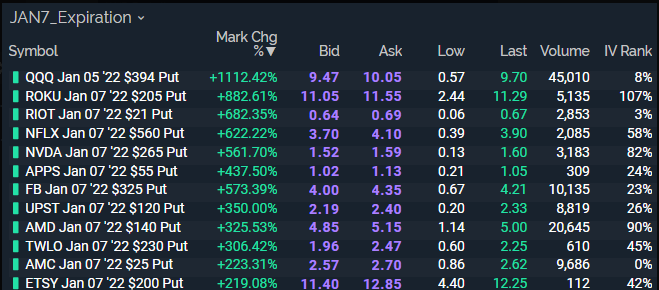
Below is a recent qualcomm options trade win for 478% using the QUALCOMM Earnings Forecast research we just described.
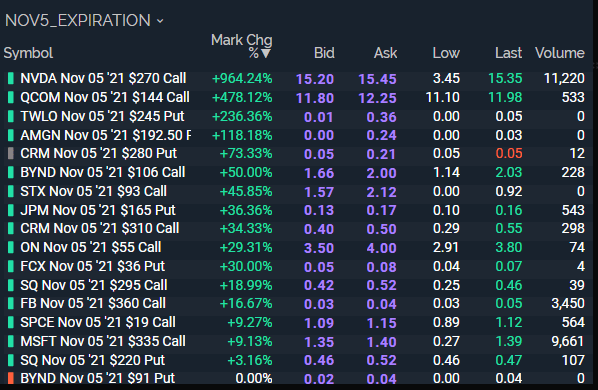
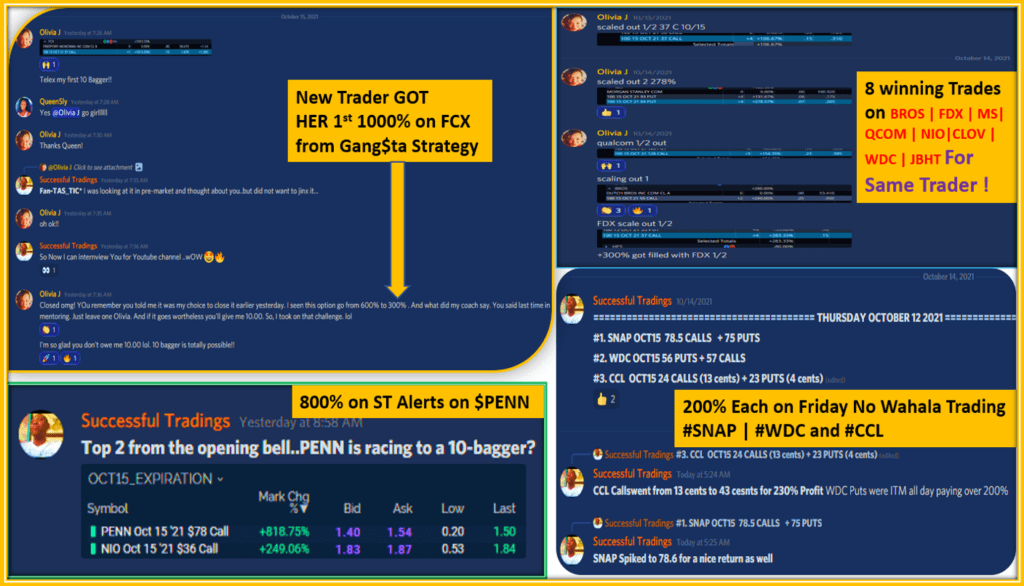
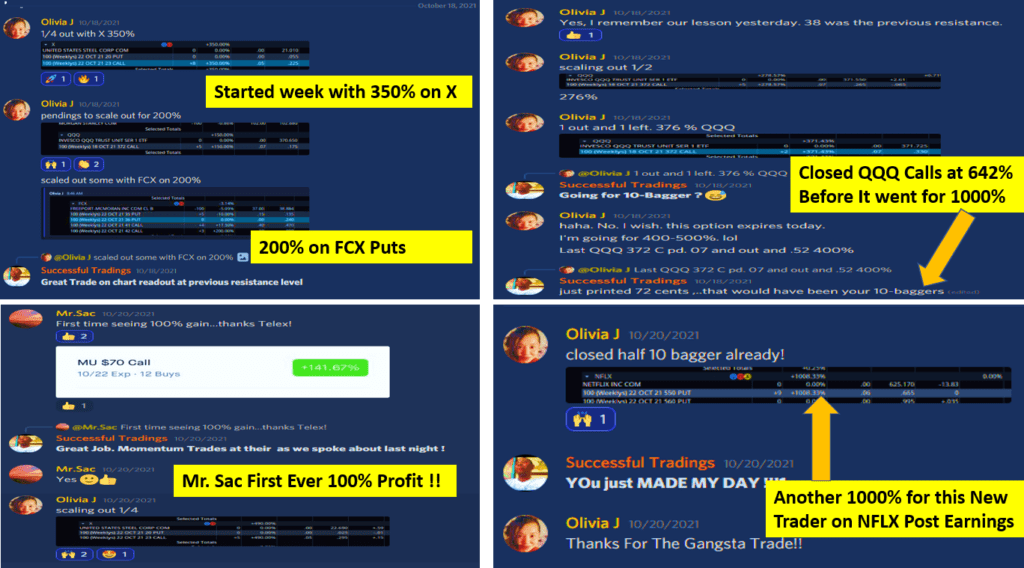
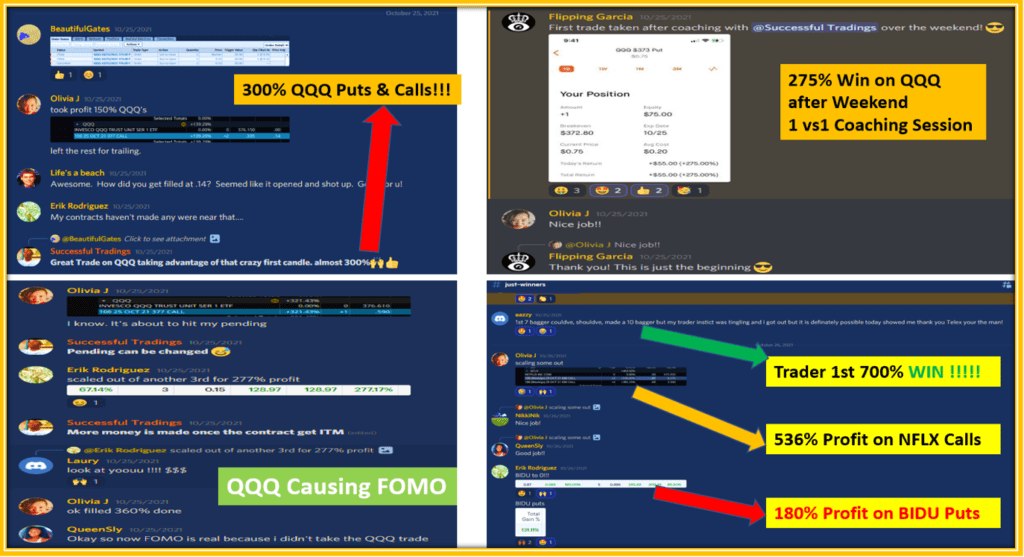
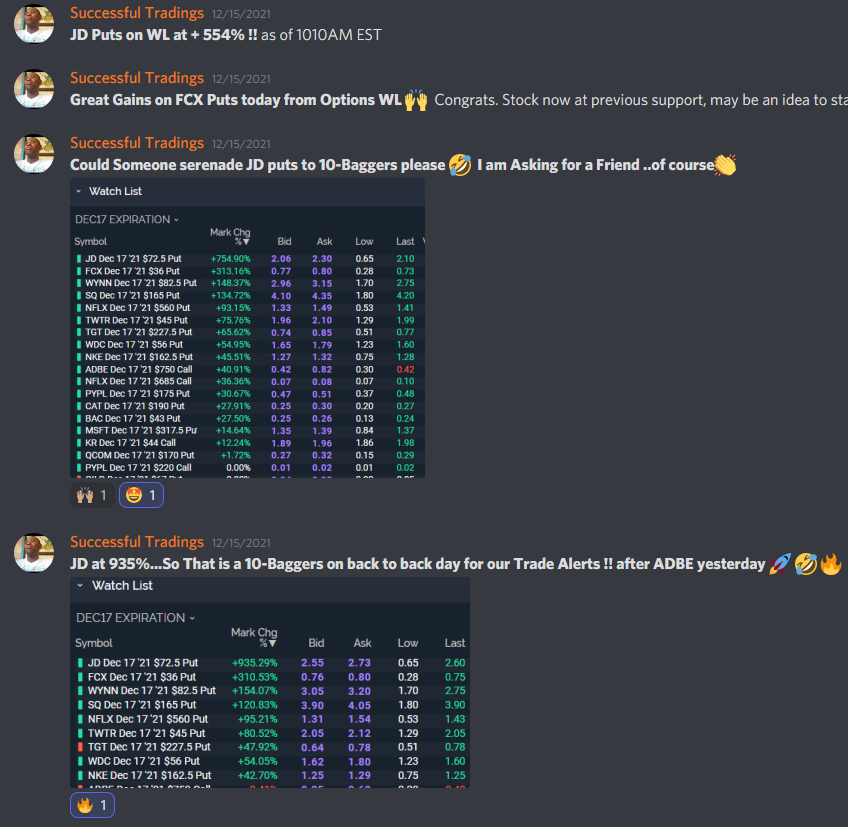
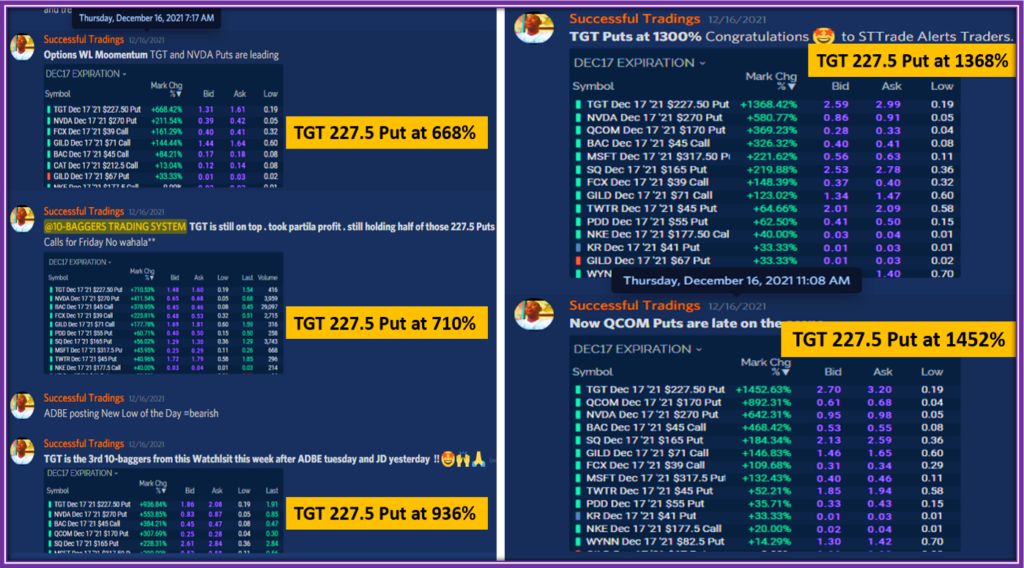
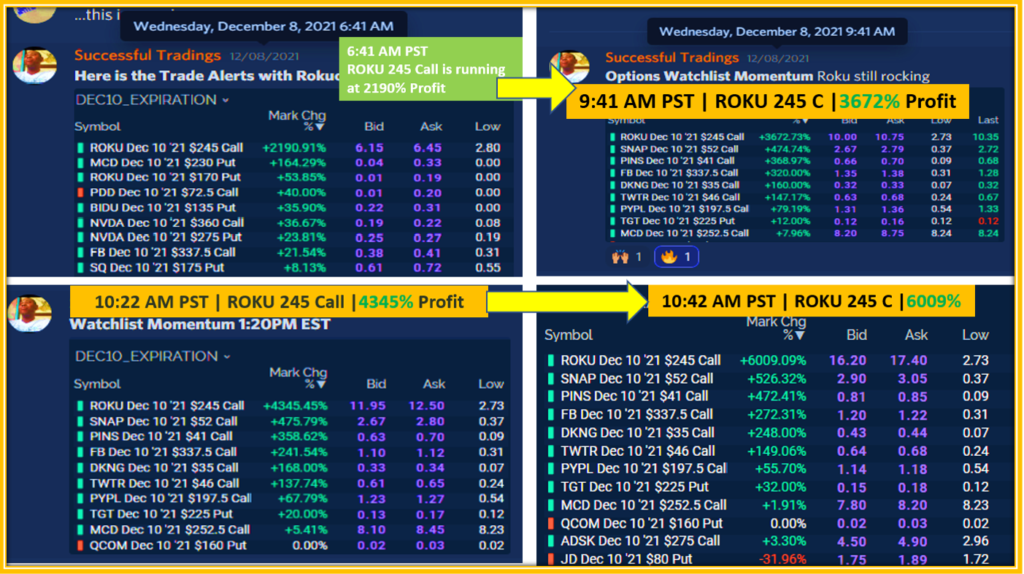
You too can leverage our 10-baggers trading system to get profit on Qualcomm stock such as the one above and on many others stock as shown below.

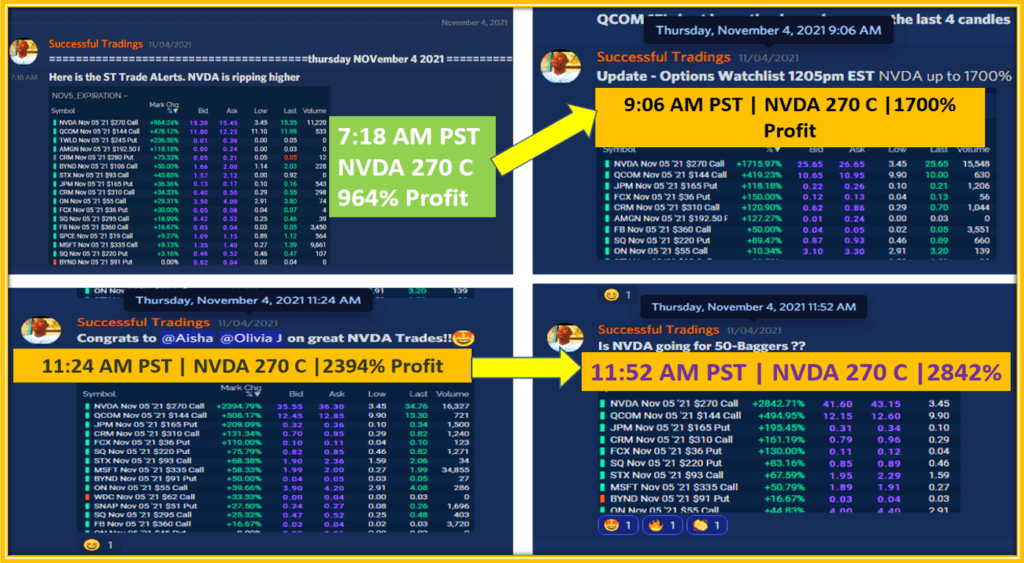
Qualcomm Stock Price Weekly Forecasts
It is quite nice to find stock such as Qualcomm that have long terms prospects.
One can then buy and hold such stocks with great confidence as stock price predictions continue to go higher and higher.
However, for those not with a great starting capital, there is another an alternative that consists of taking advantage of short-term stock price forecasts.
Qualcomm Stock price short-term Forecasts
In 2017, I was looking for a consistent way to make money in the stock market.
I discovered that over the short-term such a sone week of 2 weeks, I can accurately predict stock price variations.
Using short-term options trading on stocks such as qualcomm, we can consistently generate big profits.
How Does My Weekly Qualcomm stock price Forecast work?
My AI computer program looks for specific stock patterns each week on stock like qualcomm, NVDA, MU, BAC, AAPL.
In total, I feed the machine about 100 blue chips stocks each and in return, it forecasts which ones will be making a big move over the next 6 days.
Then, I use the empirical data for each stock to determine options strike price in both bullish and bearish directions.
I store these options in a weekly watchlist and wait for the stock to make the forecasted move and trade that direction accordingly.
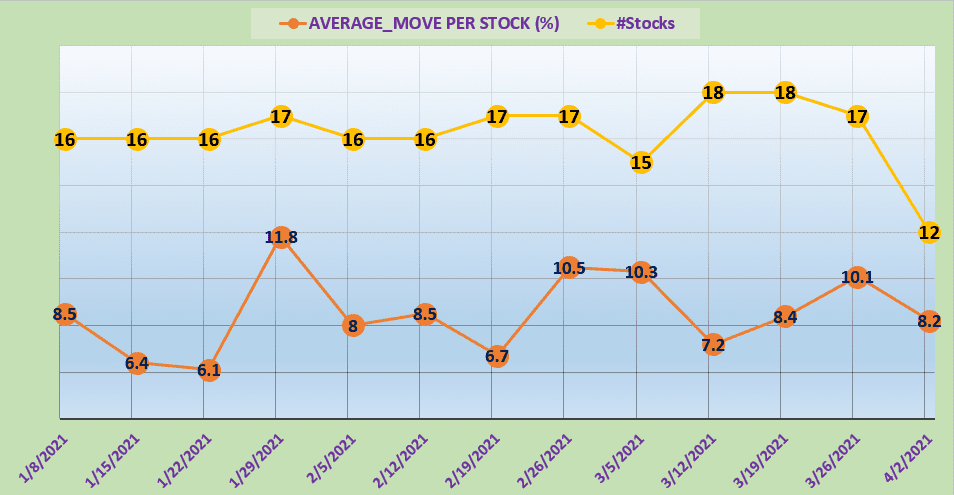
Here is the chart of the accuracy of the forecast along with the weekly average moves per stock.
How To Use Qualcomm Stock price weekly predictions ?
For each stock that my computer forecast a big price movement for the upcoming week, I set up a watchlist of options.
I will take the trade on Qualcomm stock only when either the Calls or Puts option I am tracking on the watchlist starts moving.
The forecasted stock price move is about 8% in average over the next upcoming week.
When this happens, the weekly options are bound to pay upwards of 500% gain depending on how many days are left before expiration.
Weekly Stock Price Predictions Accuracy
In case you may be wondering about the accuracy of my weekly forecast on QCOM stock price and others, I recorded weekly videos on my YouTube channel with the results.
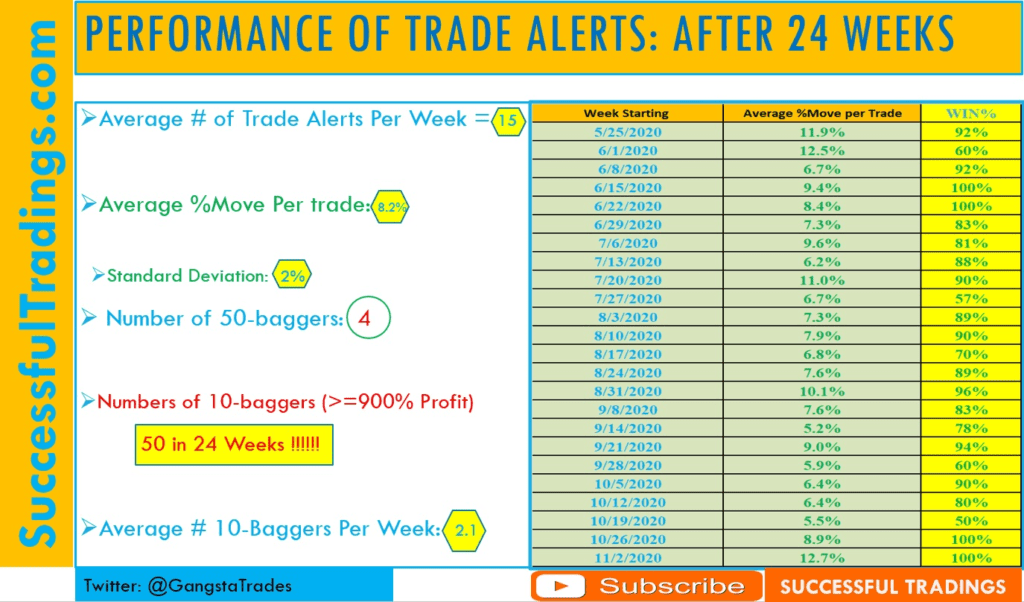
From May 2200 to November 2020 which spans 24 weeks, here is a quick summary of the overall forecasted results.
| Weekly stock Price Forecast | Performance |
| Average # Forecasted Stock Price | 15 |
| Average % Move Per Stock Price | 8.2% |
| Number of 900% Profit Trades | 50 in 24 weeks |
| Number of 5000% Profit Trades | 4 in 24 weeks |
| Average # 10-Baggers per week | 2.1 |
As you can see from the above table of results of the weekly forecasts, there is a great deal of consistency in our stock price forecast results.
Because all the stock price that my AI chine forecasts do not make the same move, I decided that we only consider those making at least a 4% move in either direction as winners.
Just for our options trading beginners, a 4% move on the underlying stock over the course of a week can easily produce 200% profit in options.
With this criterion, I can then generate the so-called win rate that many traders are so focused on.
The alt column of the graph above reveals an average accuracy of over 85%. That is not bad if I may say myself.
However, may I leave you with this question.
Would you rather trade a strategy that have a 90% accuracy and giving you 30% gains or one that only has 50% accuracy but when the forecast is correct, your gains are 500%, 600% or above?
FINAL THOUGHTS ON Qualcomm Stock Price Prediction
Qualcomm stock maybe at the beginning of a massive breakout following a very bullish Earnings.
Based on the current cost distribution of the QCOM stock, it may be astute to hold off a bit before jumping on these bullish predictions so that your entry can be closer to the average cost in the $150 range.
In the meantime, come learn how to take advantage of short-term volatility in qualcomm stock price by leveraging my Earnings Quant Analysis on QCOM as well as on multiple other stocks.

Hold a Master Degree in Electrical engineering from Texas A&M University.
African born – French Raised and US matured who speak 5 languages.
Active Stock Options Trader and Coach since 2014.
Most Swing Trade weekly Options and Specialize in 10-Baggers !
YouTube Channel: https://www.youtube.com/c/SuccessfulTradings
Other Website: https://237answersblog.com/