Average True Range or ATR in a Trading Indicator most day traders are very familiar with.
It is often displayed as a sub chart in many charting tools.
In this Tutorial, I will show you how to calculate ATR in Excel spreadsheet.
Also, you will learn to leverage the ATR indicator to improve your trading in 2022 and beyond.
How To Calculate ATR in Excel | What Is ATR?
I have been using the ATR indicator since 2016.
Traders are always surprised when I introduce the average True range in our Day Trading techniques.
There is a great deal of misconception about this statistical indicator.
My hope is that you will gain a better understanding after going through this step-by-step tutorial today.
What Is ATR (Average True Range)
In stock trading, the average True range (ATR) designates the average move of a stock over a period of time.
The move is measured as the difference between the Highest price and the lowest price on the defined timeframe.
The most used timeframe is daily.
If I tell you (a trader) that QQQ average is 4.44, this means that in average, each day, QQQ moves by $4.44 in average.
The unit of ATR is dollars or whatever currency the stock trade with.
Additionally, because it is an average, I will need to tell you over how many days this average is measured.
Typically, ATR is measured over 7days, 14 days, 21 days or 50 days.
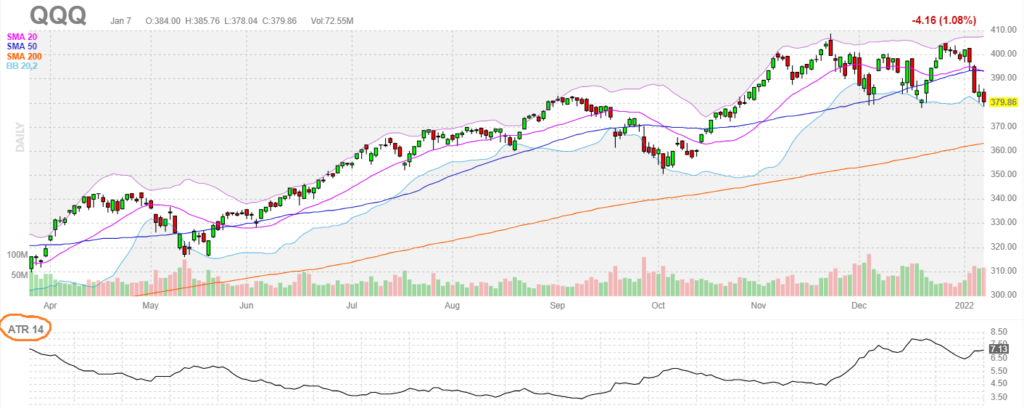
Therefore, on the above chart, QQQ shows a reading a reading of 7.13 on ATR 14.
Which means that over the last 14 days, the average daily move f QQQ stock has been $7.13.
How To Use the ATR for Stocks Selection?
Stocks traders and options traders can use ATR to select stocks to trade.
Imagine that you have two stocks you would like to day trade.
One has an ATR of 2.5 and the other one has an ATR of 3.5.
It is by far better to trade the stock with the higher ATR because you have higher probabilitytomake money.
Why Is the ATR important for Day Traders?
The ATR helps day traders and swing traders set the expected move for the trade.
For instance, if a stock has an ATR of 4 and you plan on holding a trade for 5 days, the maximum expected move over thee 5 days is $4 multiplied by 5 or $20.
I am assuming over the course of those 5 days, the stock is moving in the same direction each day.
What Does the ATR Tell Traders?
The ATR never tells traders about the direction of the stock.
This is often a big misunderstanding by newbie traders.
Stocks can move up or down.
The ATR simply measures the amplitude of those moves and summarize them into one single number.
Next, let’s consider why this number does not always tell the full story.
Let’s Calculate the ATR in Excel
Before we go into the calculation of ATR in Excel, allow me to bring a very important point that traders tend to forget.
Limitations of ATR
As stated earlier that the ATR is an average of a timeline, you need to be mindful that one outlier data point can skew the statistical indicator.
How is this possible ?
Let’s suppose that a stock typical ATR is 3 and then a news come along and the stop jumps up or down.
The new calculated ATR will include this big data point and severely change the ATR measure.
This is even more pronounced when this average is taken over a short duration.
ATR 14 vs ATR 50
The most common questions traders have for ATR is which timeline to use to calculate the Average True range.
7 days can easily be skewed by a big outlier especially during earnings seasons when the implied volatility jumps a lot.
In the summary table below, I have selected different ATRS over 4 timelines and provided the Pros and cons in using each one.
| ATR Type | Pros | CONS |
|---|---|---|
| ATR 7 | Provide the most recent information | It can easily be skewed by one outlier |
| ATR 14 | Recent information is captured | Enough data points to smooth out outlier |
| ATR 21 | Enough days to smooth out one outlier | old data does not focus on most data |
| ATR 50 | Can smooth out a lot of outliers | too old data does not focus on recent data |
As an illustration of the above table, below is the plot of the ATR 7 vs ATR14 for QQQ for the entire year 2020.
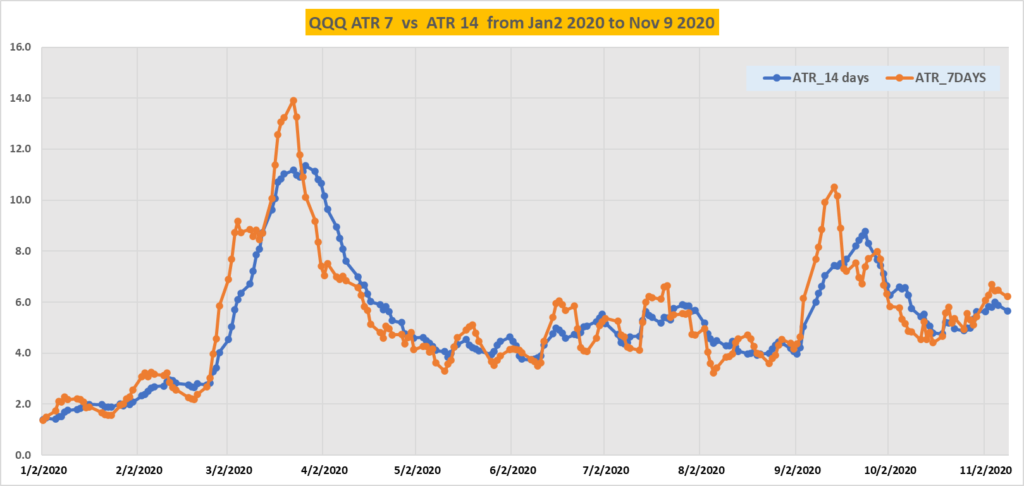
We can clearly see that the ATR 7 is more volatile than the ATR 14 which is much smoother.
I chose 2020 0to showcase the impact of high volatility between late February 2020 and March 23, 2020.
You can check it out on the stock chart for QQQ and other stocks: the ATR tends to go much higher when the stock is going down.
This is one of the reasons why options traders should prefer to trade puts vs calls if they have the choice.
Because the ATR goes higher when the stock is trending down, there is more money make trading puts.
What You Need to Calculate ATR in Excel
The first step in order to calculate the ATR in excel is to have the daily price for the stock you want to calculate the ATR for.
The two stock prices that you need are the high and the Low for each day.
Where to Get the Data for ATR Calculation in Excel
You can download the daily stock price online.
I typically use yahoo finance to get this data before I process it on Excel.
Step-by-Step How to Calculate ATR in Excel
- Get stock price daily price in excel
- Add a column to you Dataset – Call it Daily Range
- Daily Range = High – Low
- Add another column – Call it ATR14
- Fill out the Formula for ATR 14 starting at row 15: average of Daily Range over previous 14 days
- Drag your Formula from Row 16 all the way to the end of your Excel table
- Plot on a graph the ATR 14
Step-by-Step Video on How to Calculate ATR in excel
Download my free Excel Spreadsheet Template on how to Calculate ATR in excel.
How To Use the ATR To Improve Your Options Trading
There are several applications for the Average True Range.
Below are some of the most popular ones you can learn about to improve your Day trading.
How To Use ATR For choosing an Option Strike Price
Options traders need to select a strike price in order to trade options.
One easy and quick method to do this is to use the ATRtechnique.
Since we know that the ATR provides a potential move for each day, it is very convenient for swing trading in options.
The video below provides a full description on how you can do that.
How To Use ATR For Trailing Stop Loss
You can also use the ATR information to set your Trailing stop loss.
Let’s suppose you bought a stock that is trending higher.
You are making good profit on it already and want to protect your gains while hoping for more profit.
You can then select to use the ATR as a Trailing stop.
Which means that if your stock retreats by amount equal to ATR or a fraction of it, you will exit the trade.
How Average True Range ATR will Improve your Trading
For Long Tern Investor
Trailing Stop loss is the application of the ATR for long term investors.
This is a great technique that will help you protect your gains while hoping for future profit profits.
For a Stock Day Trader or Swing Trader
You should use ATR in your stock day trading strategy because you will be able to select stocks with higher ATRs thus increasing your potential profits.
Secondly, you will be able to determine based on the ATR statistic whether you can hold on for a little longer or close it for the day because the expected ATR has already been reached.
For an Option Day Trader or Swing Trader
If you are an option trader, you can use the Average True Range ATR indicator to select the optimum strike price.
This will help you find a nice compromise between cost of the options and the probability of making money.
ATR has multiple applications
Average True Range can be used in stocks trading, Forex Trading, Crypto trading and options trading.
Therefore, it has multiple ecosystems in which traders can leverage this very important statistical indicator.
FINAL THOUGHTS ON HOW To Calculate ATR In Excel
I showcased how to calculate ATR in excel using a very easy and quick step-by-step process.
You can go this for any stock in less than 5 minutes.
Should you decide to learn more, you can download my free Excel spreadsheet template for ATR Calculation.

Hold a Master Degree in Electrical engineering from Texas A&M University.
African born – French Raised and US matured who speak 5 languages.
Active Stock Options Trader and Coach since 2014.
Most Swing Trade weekly Options and Specialize in 10-Baggers !
YouTube Channel: https://www.youtube.com/c/SuccessfulTradings
Other Website: https://237answersblog.com/