I began trading in 2015 and started coaching in 2019. Support levels offer some of the highest probability trading opportunities in the market. However, many traders fail to identify genuine support or enter positions incorrectly. Therefore, this guide teaches you to trade support levels systematically for consistent profits.
👉 In this guide, you will learn:
- 📊 How to identify genuine support levels that actually hold
- 💰 Entry strategies that maximize profit while minimizing risk
- 🎯 Position sizing techniques for support level trades
- 📈 Risk management systems that protect your capital
- 🔍 Tools and indicators that confirm support strength
- ⚖️ When to exit profitable support trades for maximum gains
- 🚨 Warning signs that indicate support levels may break
Trading near support levels provides clear entry points with defined risk parameters. Moreover, successful support trades often generate significant returns quickly. Additionally, support trading works across all timeframes and market conditions when applied correctly.
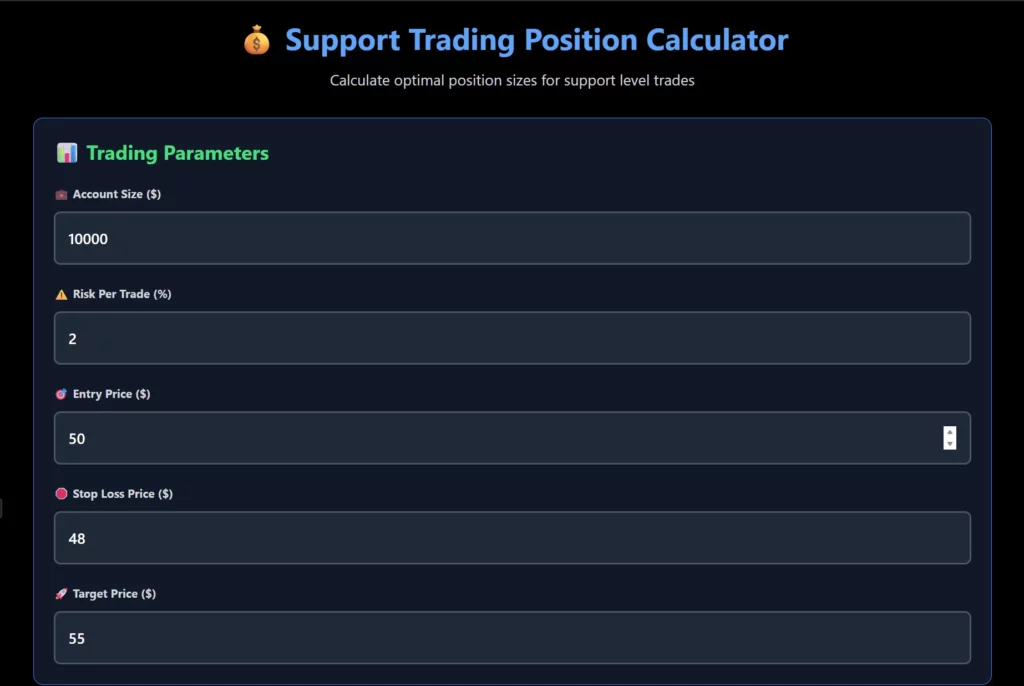
Table of Contents
Understanding Support Levels: Foundation for Profitable Trading 📊
Support levels represent price areas where buying interest historically exceeds selling pressure. Furthermore, these levels act as psychological barriers that influence trader behavior significantly. Additionally, institutional trading often concentrates around these key technical levels.
What Makes Support Levels Reliable
Historical Price Action Confirmation Strong support levels demonstrate multiple successful tests over time. Moreover, each successful test strengthens the psychological importance of the level. Furthermore, volume patterns often confirm the strength of support during these tests.
Key characteristics of reliable support:
- 📈 Multiple bounces from the same price level
- 📊 Increasing volume during bounces from support
- ⏰ Support holds across different timeframes consistently
- 💡 Round numbers often create psychological support levels
Volume Analysis at Support Volume provides crucial confirmation of support level strength. However, different volume patterns indicate varying levels of reliability. Therefore, understanding volume dynamics improves support trading success dramatically.
Volume patterns that confirm support strength:
- 🔊 High volume during initial support formation
- 🔊 Declining volume during pullbacks to support
- 🔊 Volume expansion when price bounces from support
- 🔊 Institutional accumulation patterns near support levels
Psychological Factors Behind Support Market psychology drives support level effectiveness more than mathematical formulas. Furthermore, trader emotions create predictable behaviors around these levels. Additionally, algorithmic trading often targets these psychological levels for execution.
Technical Analysis Tools for Support Identification 🔍
Professional traders use multiple tools to identify and confirm support levels accurately. Moreover, combining different analytical approaches increases the probability of successful trades. Furthermore, technology enables sophisticated analysis that was impossible decades ago.
Moving Average Support Systems
Dynamic Support Identification Moving averages create dynamic support levels that adjust with price trends. However, certain moving average periods prove more reliable than others. Therefore, testing different combinations helps identify the most effective setups.
Most effective moving averages for support trading:
- 📊 20-period exponential moving average for short-term support
- 📊 50-period simple moving average for intermediate support
- 📊 200-period moving average for long-term trend support
- 📊 Multiple timeframe analysis for confluence confirmation
Moving Average Confluence Multiple moving averages converging near the same price level create powerful support zones. Furthermore, these confluence areas often produce the strongest bounces. Additionally, professional traders specifically target these high-probability setups.
Fibonacci Retracement Support Levels
Mathematical Precision in Support Trading Fibonacci levels provide mathematically-derived support areas that institutional traders watch closely. Moreover, these levels often align with psychological support zones. Furthermore, combining Fibonacci analysis with other tools improves accuracy significantly.
Key Fibonacci levels for support trading:
- 📐 38.2% retracement level for shallow pullback support
- 📐 50% retracement for moderate correction support
- 📐 61.8% golden ratio level for deep retracement support
- 📐 78.6% extreme retracement before trend reversal
Multiple Timeframe Fibonacci Analysis Professional traders analyze Fibonacci levels across multiple timeframes simultaneously. However, longer timeframe levels typically carry more weight. Therefore, weekly and daily Fibonacci levels often override shorter-term analysis.
Entry Strategies for Support Level Trading 🎯
Successful support trading requires precise entry techniques that optimize risk-reward ratios. Moreover, different market conditions require different entry approaches. Furthermore, timing becomes crucial for maximizing profits while minimizing exposure to losses.
The Bounce Confirmation Entry Method
Waiting for Price Confirmation Many traders enter positions too early when approaching support levels. However, waiting for bounce confirmation reduces false breakout losses significantly. Therefore, patience often proves more profitable than aggressive early entry.
Bounce confirmation signals:
- 📈 Price closes above support after touching the level
- 📈 Volume increases during the bounce from support
- 📈 Bullish candlestick patterns form at the support level
- 📈 Momentum indicators show positive divergence
Scale-in Entry Technique Rather than entering full positions immediately, scaling in allows risk management optimization. Furthermore, this approach enables adding to winning positions strategically. Additionally, scale-in entries reduce the impact of initial timing errors.
Scale-in entry framework:
- 🎯 25% position when price first touches support
- 🎯 25% additional when bounce confirmation appears
- 🎯 25% more if support holds and uptrend resumes
- 🎯 Final 25% only after clear bullish momentum develops
The Anticipation Entry Strategy
Early Entry for Maximum Reward Experienced traders sometimes enter positions before reaching support levels. However, this approach requires sophisticated risk management systems. Moreover, anticipation entries work best in trending markets with clear support patterns.
Requirements for anticipation entries:
- 💡 Strong historical support with multiple successful tests
- 💡 Clear trend direction favoring the support trade
- 💡 Tight stop-losses to limit downside risk quickly
- 💡 Position sizing appropriate for higher uncertainty
Risk Management Systems for Support Trading ⚖️
Risk management determines long-term success more than entry technique. Therefore, systematic approaches to position sizing and stop-loss placement prove essential. Furthermore, emotional discipline becomes crucial when trades move against expectations.
Position Sizing for Support Trades
The 1% Risk Rule Application Professional traders typically risk only 1-2% of trading capital per position. However, support trades often allow tighter stop-losses enabling larger position sizes. Therefore, risk-adjusted position sizing optimizes return potential while protecting capital.
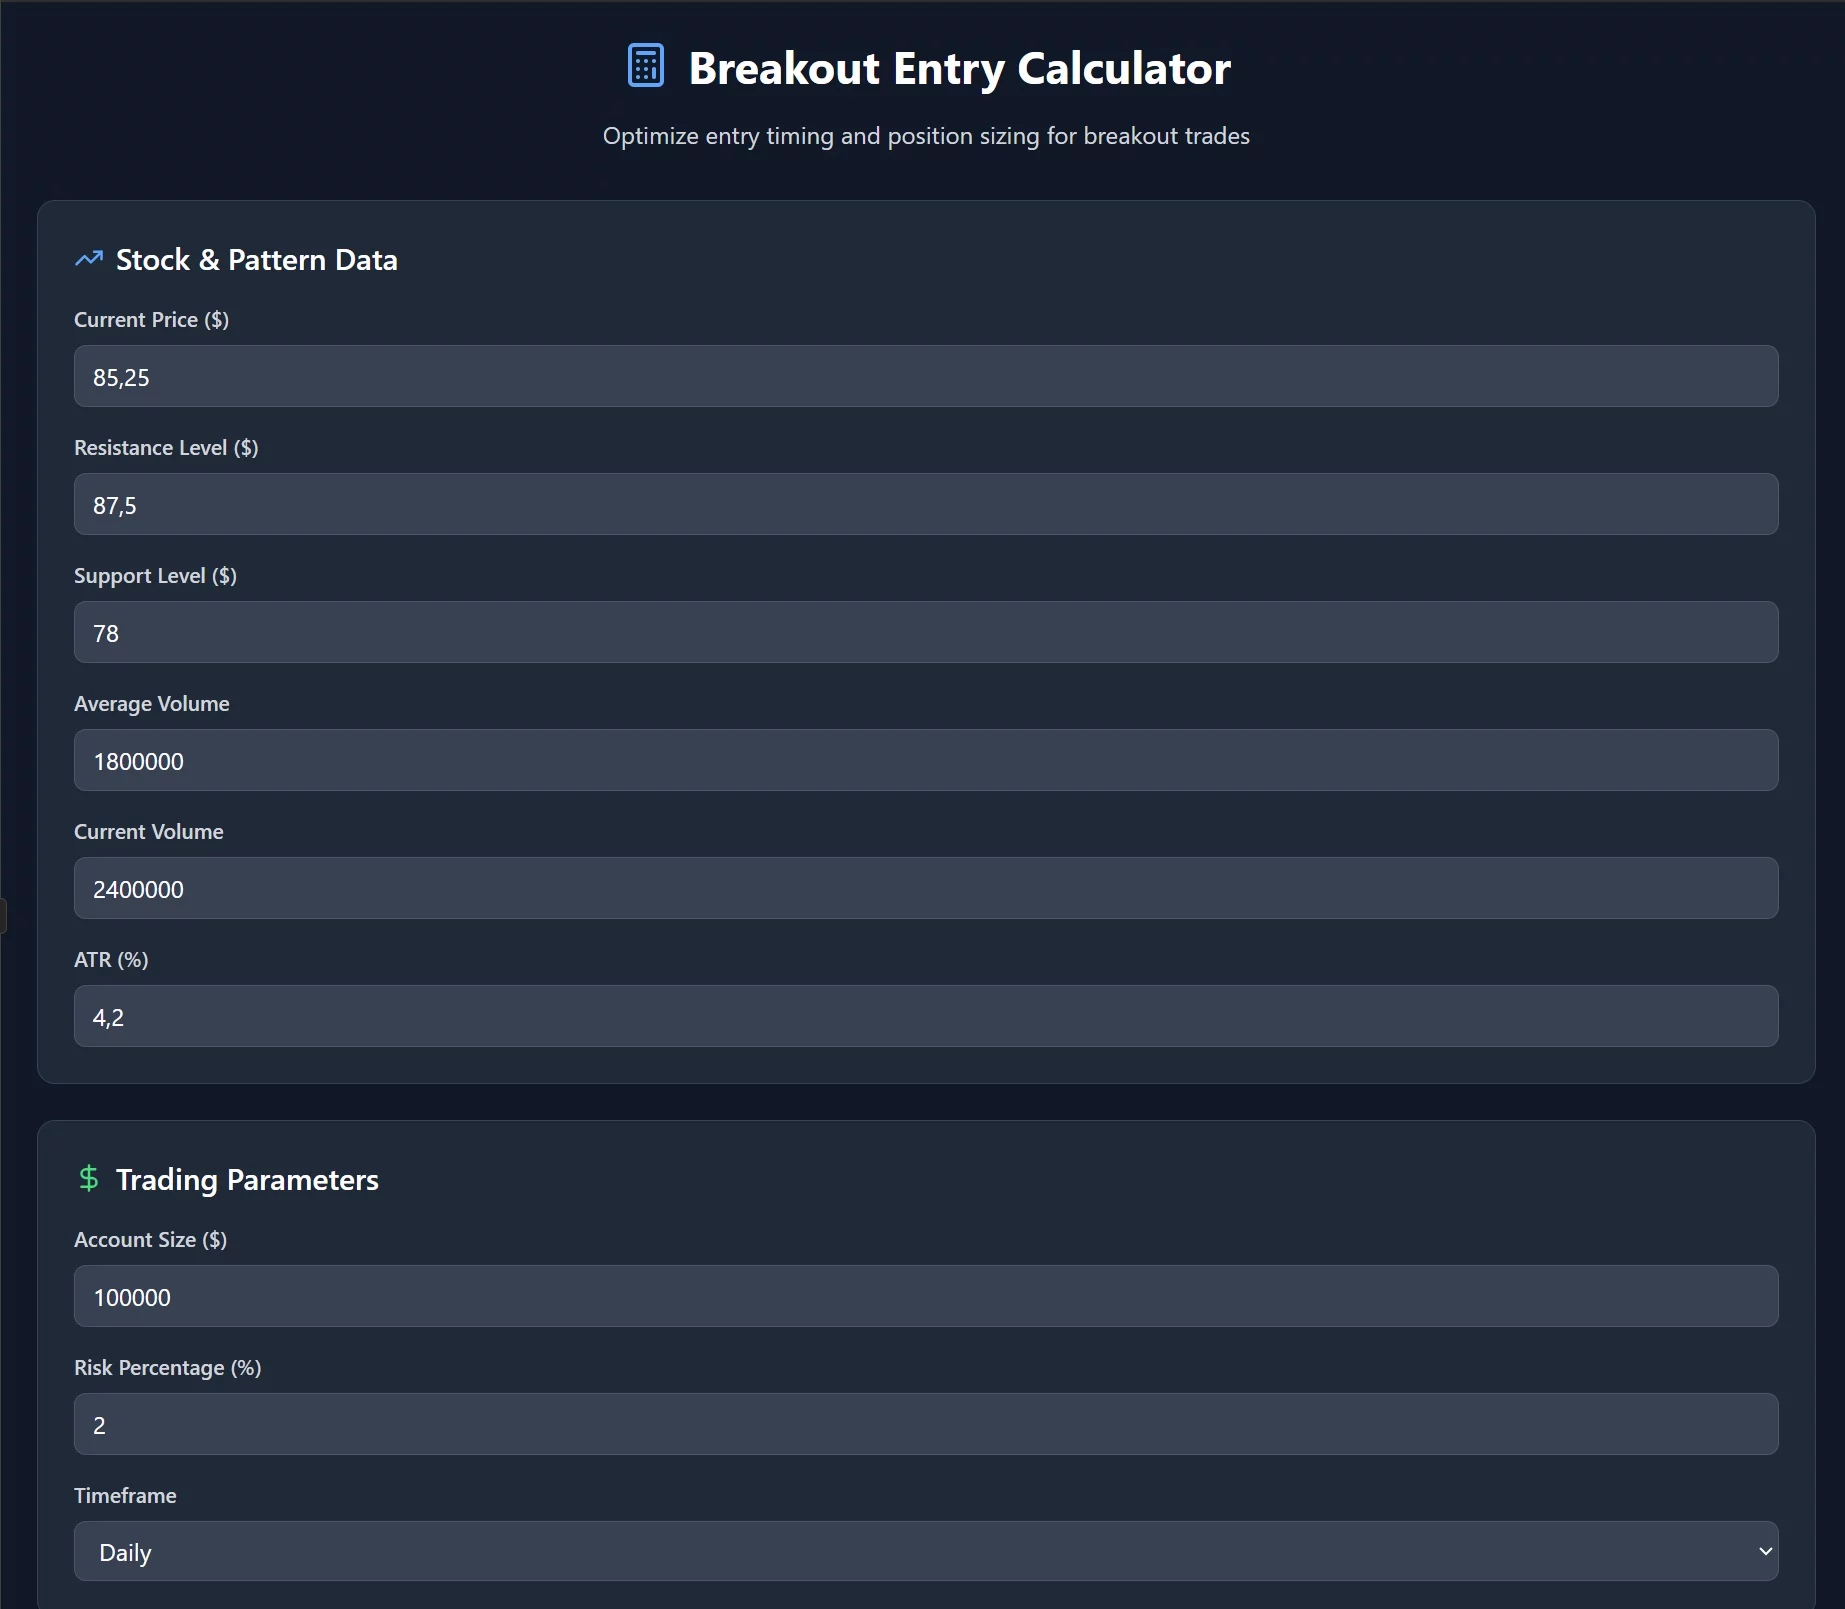
Position sizing calculation method:
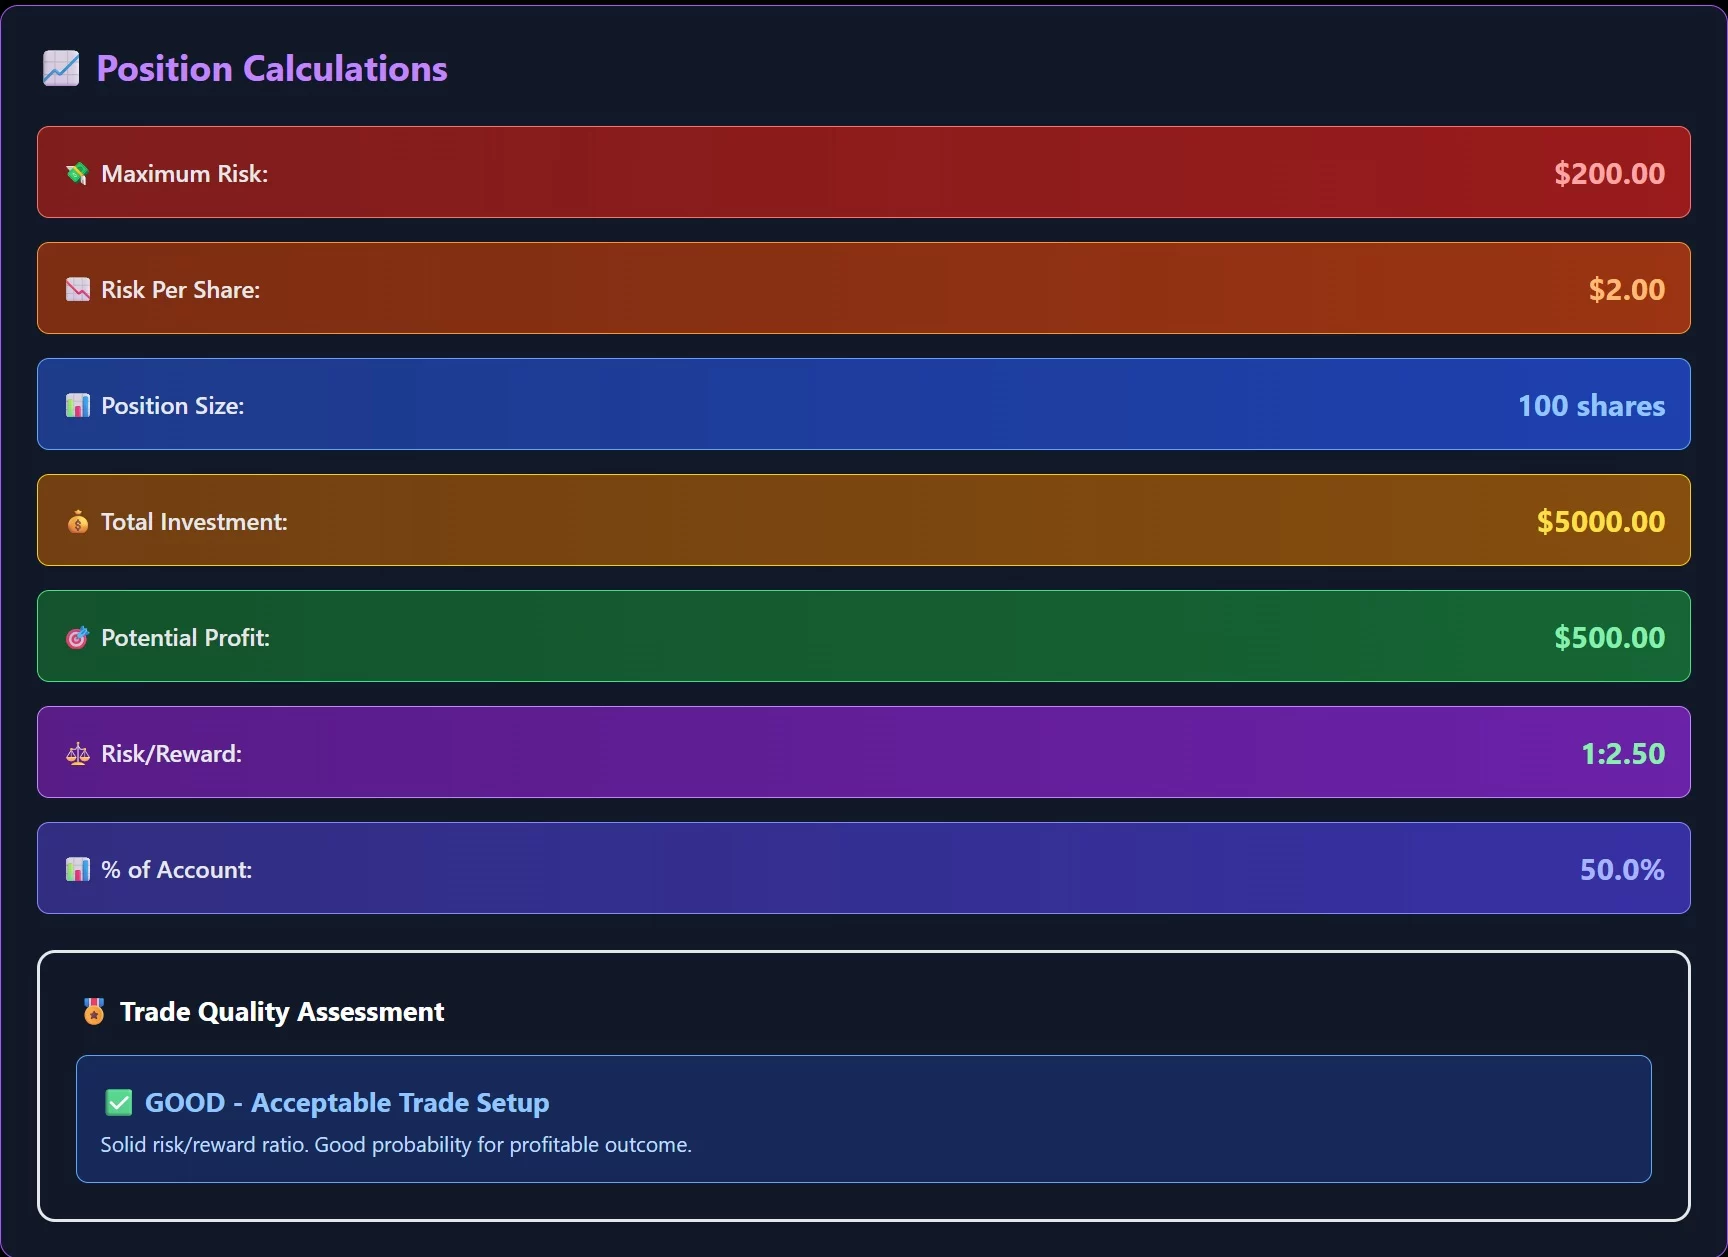
- 💰 Account size × Risk percentage = Maximum loss per trade
- 💰 Entry price – Stop loss price = Risk per share
- 💰 Maximum loss ÷ Risk per share = Position size
- 💰 Adjust for commissions and slippage factors
Volatility-Adjusted Position Sizing Different stocks exhibit varying volatility patterns requiring position size adjustments. Moreover, highly volatile stocks require smaller positions despite attractive setups. Furthermore, low-volatility stocks may justify larger positions with similar risk profiles.
Stop-Loss Placement Strategies
Technical Stop-Loss Levels Stop-losses for support trades should account for normal price fluctuations below support. However, placing stops too close results in premature exit from profitable trades. Therefore, balancing protection with breathing room becomes crucial.
Technical stop-loss guidelines:
- 🛑 Place stops 2-3% below major support levels
- 🛑 Consider average true range for volatility adjustment
- 🛑 Use previous swing lows as natural stop-loss levels
- 🛑 Avoid round numbers that attract false breakout manipulation
Trailing Stop-Loss Systems Profitable support trades often continue beyond initial targets. Therefore, trailing stops protect gains while allowing continued upside participation. Furthermore, systematic trailing approaches remove emotional decision-making from profit management.
Market Conditions That Favor Support Trading 📈
Support trading effectiveness varies significantly across different market environments. Moreover, understanding these conditions helps traders focus efforts during optimal periods. Additionally, avoiding unfavorable conditions prevents unnecessary losses and frustration.
Trending Markets vs. Sideways Markets
Support Trading in Uptrends Uptrending markets provide ideal conditions for support level trading. Furthermore, institutional buying often concentrates near support levels during healthy uptrends. Additionally, successful support bounces frequently lead to new highs in trending markets.
Uptrend support trading advantages:
- 📊 Strong underlying momentum supports bounce probability
- 📊 Institutional accumulation patterns favor long positions
- 📊 Break above resistance often follows successful support bounces
- 📊 Risk-reward ratios typically favor support trades significantly
Sideways Range Trading Opportunities Range-bound markets create repetitive support and resistance patterns. However, these conditions require different approaches than trending market strategies. Therefore, range trading techniques become essential for consistent profitability.
Range-bound market considerations:
- ↔️ Support and resistance levels become more predictable
- ↔️ Mean reversion strategies work better than momentum approaches
- ↔️ Position sizing may increase due to defined risk parameters
- ↔️ Profit targets should align with opposing resistance levels
Volume Patterns and Market Sentiment
Institutional Accumulation Patterns Professional money managers often accumulate positions near strong support levels. Furthermore, recognizing these patterns provides insight into potential price direction. Additionally, following institutional footprints improves retail trading success significantly.
Signs of institutional accumulation:
- 🏢 Large block trades executing near support levels
- 🏢 Volume-weighted average price clustering around support
- 🏢 Options flow indicating bullish positioning
- 🏢 Reduced volatility despite proximity to support
Advanced Support Trading Techniques 🚀
Experienced traders employ sophisticated techniques to enhance support trading profitability. Moreover, these advanced methods require deeper market understanding and disciplined execution. Furthermore, technology enables analysis that was previously impossible for retail traders.
Multiple Timeframe Confluence Trading
Aligning Different Timeframe Perspectives Professional traders analyze support levels across multiple timeframes simultaneously. However, longer timeframes typically override shorter-term signals. Therefore, achieving confluence across timeframes dramatically improves success rates.
Multiple timeframe analysis process:
- 📅 Weekly charts for major trend direction
- 📅 Daily charts for intermediate support levels
- 📅 4-hour charts for precise entry timing
- 📅 1-hour charts for final execution confirmation
Priority Hierarchy for Conflicting Signals Different timeframes sometimes provide conflicting support signals. Therefore, establishing priority hierarchies prevents analysis paralysis. Furthermore, systematic approaches eliminate emotional decision-making during complex setups.
Options Strategies for Support Trading
Protective Put Strategies Options provide insurance for support trading positions while maintaining upside potential. Moreover, protective puts enable larger position sizes with defined maximum losses. Additionally, options strategies can enhance returns in sideways markets.
Basic protective put implementation:
- 🎛️ Buy shares near support level
- 🎛️ Purchase put options below support for protection
- 🎛️ Choose expiration dates allowing adequate time
- 🎛️ Monitor time decay impact on option premiums
Cash-Secured Put Selling Selling puts near support levels generates income while potentially acquiring shares at desired prices. However, this strategy requires sufficient cash reserves. Furthermore, put selling works best in stable or rising market environments.
Common Support Trading Mistakes to Avoid 🚨
Understanding typical mistakes helps traders avoid costly errors that destroy profitability. Furthermore, these mistakes often result from psychological biases rather than technical analysis failures. Therefore, systematic approaches and emotional discipline prevent most common pitfalls.
Early Entry and False Breakout Traps
Jumping the Gun on Support Bounces Many traders enter positions before confirming actual support bounces. However, premature entries often result in losses when support fails initially. Therefore, waiting for confirmation typically improves overall profitability despite occasional missed opportunities.
Premature entry warning signs:
- ⚠️ Entering before price actually reaches support level
- ⚠️ Ignoring volume patterns that suggest weakness
- ⚠️ Failing to wait for bounce confirmation signals
- ⚠️ Using position sizes inappropriate for uncertainty level
False Breakout Recovery Trades Some traders attempt to catch falling knives when support levels break initially. However, false breakouts require different strategies than genuine support bounces. Moreover, these situations involve higher risk requiring smaller position sizes.
Overconfidence and Position Sizing Errors
The “Sure Thing” Mentality Strong support levels sometimes create overconfidence that leads to excessive position sizes. However, even the strongest support levels eventually break under sufficient selling pressure. Therefore, maintaining consistent risk management prevents catastrophic losses.
Position sizing discipline requirements:
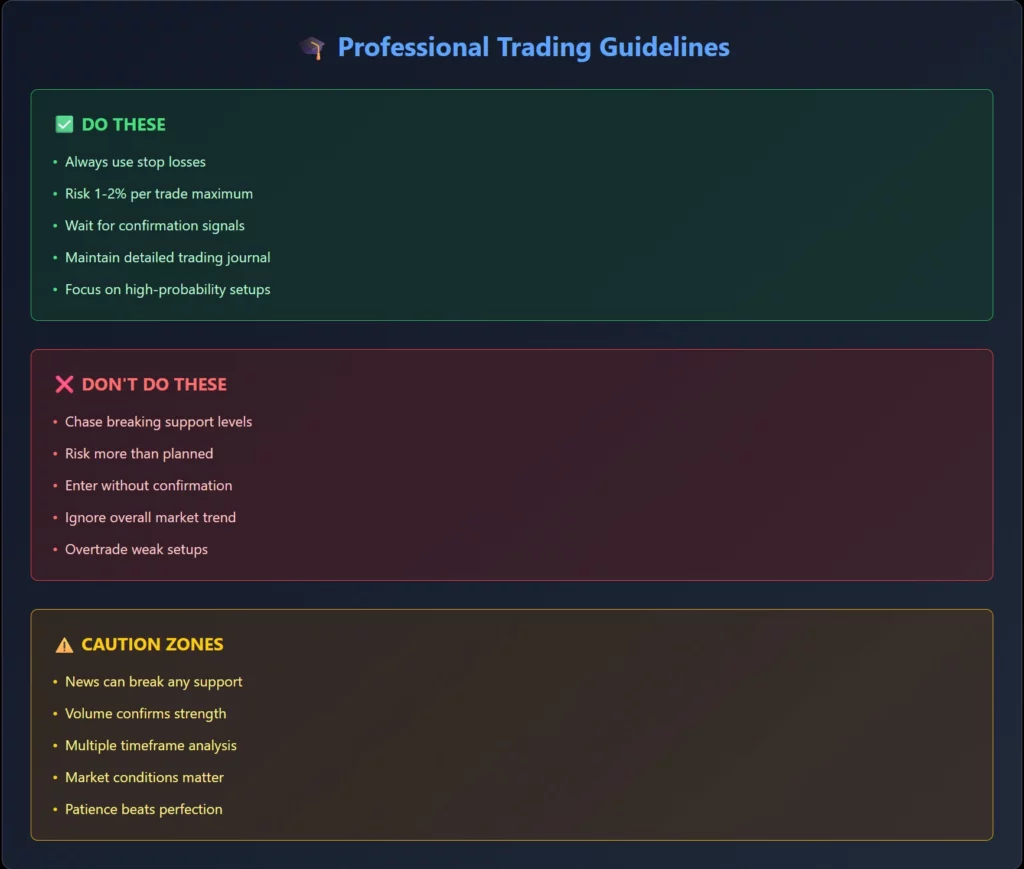
- 💡 Never risk more than 2% per trade regardless of confidence
- 💡 Consider correlation risk when trading multiple support setups
- 💡 Adjust for overall market conditions and volatility
- 💡 Account for slippage and execution costs in calculations
Technology and Tools for Modern Support Trading 💻
Modern trading technology provides unprecedented analysis capabilities for support level identification. Furthermore, automation enables systematic execution that eliminates emotional interference. Additionally, mobile technology allows monitoring and management from anywhere globally.
Algorithmic Support Detection
Automated Level Identification Modern software can automatically identify potential support levels across thousands of stocks simultaneously. However, human judgment remains essential for confirming the quality of these levels. Therefore, combining algorithmic detection with manual analysis optimizes efficiency.
Automated detection capabilities:
- 🤖 Scanning multiple timeframes for support confluence
- 🤖 Volume-weighted support level calculation
- 🤖 Statistical significance testing for support strength
- 🤖 Real-time alerts when price approaches identified levels
Machine Learning Pattern Recognition Advanced algorithms can identify complex support patterns that human analysis might miss. Moreover, machine learning improves accuracy through continuous pattern recognition refinement. Furthermore, these systems can process enormous amounts of historical data quickly.
Mobile Trading and Alert Systems
Real-Time Support Level Monitoring Professional traders use sophisticated alert systems to monitor support levels continuously. However, too many alerts can create information overload. Therefore, filtering systems help focus on the highest probability opportunities only.
Essential alert system features:
- 📱 Price proximity alerts for identified support levels
- 📱 Volume spike notifications during support tests
- 📱 Momentum indicator divergence warnings
- 📱 Multiple timeframe confluence confirmations
FAQs 🤔
How do I identify the strongest support levels? Look for levels with multiple historical bounces, high volume during formation, and psychological significance (round numbers). Confluence of technical indicators strengthens reliability significantly.
What’s the best timeframe for support trading? Daily charts provide the best balance between reliability and trading frequency. However, analyze weekly charts for major levels and use shorter timeframes for precise entry timing.
How long should I hold support bounce trades? Hold until reaching resistance levels or stop-loss triggers. Typical holding periods range from days to weeks depending on the timeframe analyzed and market momentum.
Should I trade support in bear markets? Support trading becomes more challenging in bear markets but remains viable with proper risk management. Focus on the strongest support levels and use smaller position sizes.
How do I know when support will break? Watch for declining volume at support tests, momentum indicator divergence, and broader market weakness. However, always use stop-losses since support breaks can’t be predicted with certainty.
What position size should I use for support trades? Risk 1-2% of trading capital per position. Calculate position size based on the distance to your stop-loss level to maintain consistent risk across all trades.
How do moving averages help with support trading? Moving averages provide dynamic support levels that adjust with trends. The 20, 50, and 200-period moving averages often act as support in trending markets.
Should I use options for support trading? Options can enhance support trading through protective puts or cash-secured put selling. However, ensure you understand options mechanics and time decay effects before implementation.
Conclusion
Support level trading offers systematic approaches to consistent market profits when executed with proper risk management and technical analysis. Moreover, combining multiple confirmation techniques dramatically improves success rates over time.
Success requires patience to wait for high-probability setups rather than forcing trades in marginal situations. Furthermore, systematic position sizing and stop-loss placement protect capital during inevitable losing trades.
Finally, continuous education and practice help traders refine their support level identification skills and execution techniques for long-term profitability in all market environments.
I began trading in 2015 and started coaching in 2019. Trading QQQ (Invesco QQQ Trust) has taught me invaluable lessons about markets, psychology, and wealth building. However, these lessons came through both profitable trades and painful mistakes. Therefore, this guide shares my most important discoveries from seven years of active QQQ trading. 👉 In this guide, you will learn: QQQ represents the Nasdaq-100 index, comprising the largest non-financial companies. Furthermore, it provides concentrated exposure to technology, innovation, and growth sectors. …
I began trading in 2015 and started coaching in 2019. Support levels offer some of the highest probability trading opportunities in the market. However, many traders fail to identify genuine support or enter positions incorrectly. Therefore, this guide teaches you to trade support levels systematically for consistent profits. 👉 In this guide, you will learn: Trading near support levels provides clear entry points with defined risk parameters. Moreover, successful support trades often generate significant returns quickly. Additionally, support trading works …
I began trading in 2015 and started coaching in 2019. Breakout trading represents one of the most profitable strategies for capturing explosive stock moves. However, false breakouts destroy more accounts than any other trading mistake. Therefore, this guide reveals how to identify genuine breakouts and maximize profits while avoiding costly traps. 👉 In this guide, you will learn: Breakout trading attracts novice traders due to its apparent simplicity and profit potential. Additionally, social media showcases spectacular breakout gains without revealing …
I began trading in 2015 and started coaching in 2019. All-time highs create both tremendous opportunities and dangerous traps for traders. However, many investors avoid markets during peak periods and miss substantial profits. Therefore, this guide reveals how to trade successfully when stocks reach unprecedented levels. 👉 In this guide, you will learn: All-time highs trigger fear in most investors despite representing optimal trading conditions. Additionally, media narratives about “overvaluation” create panic selling opportunities. Furthermore, professional traders systematically exploit retail …
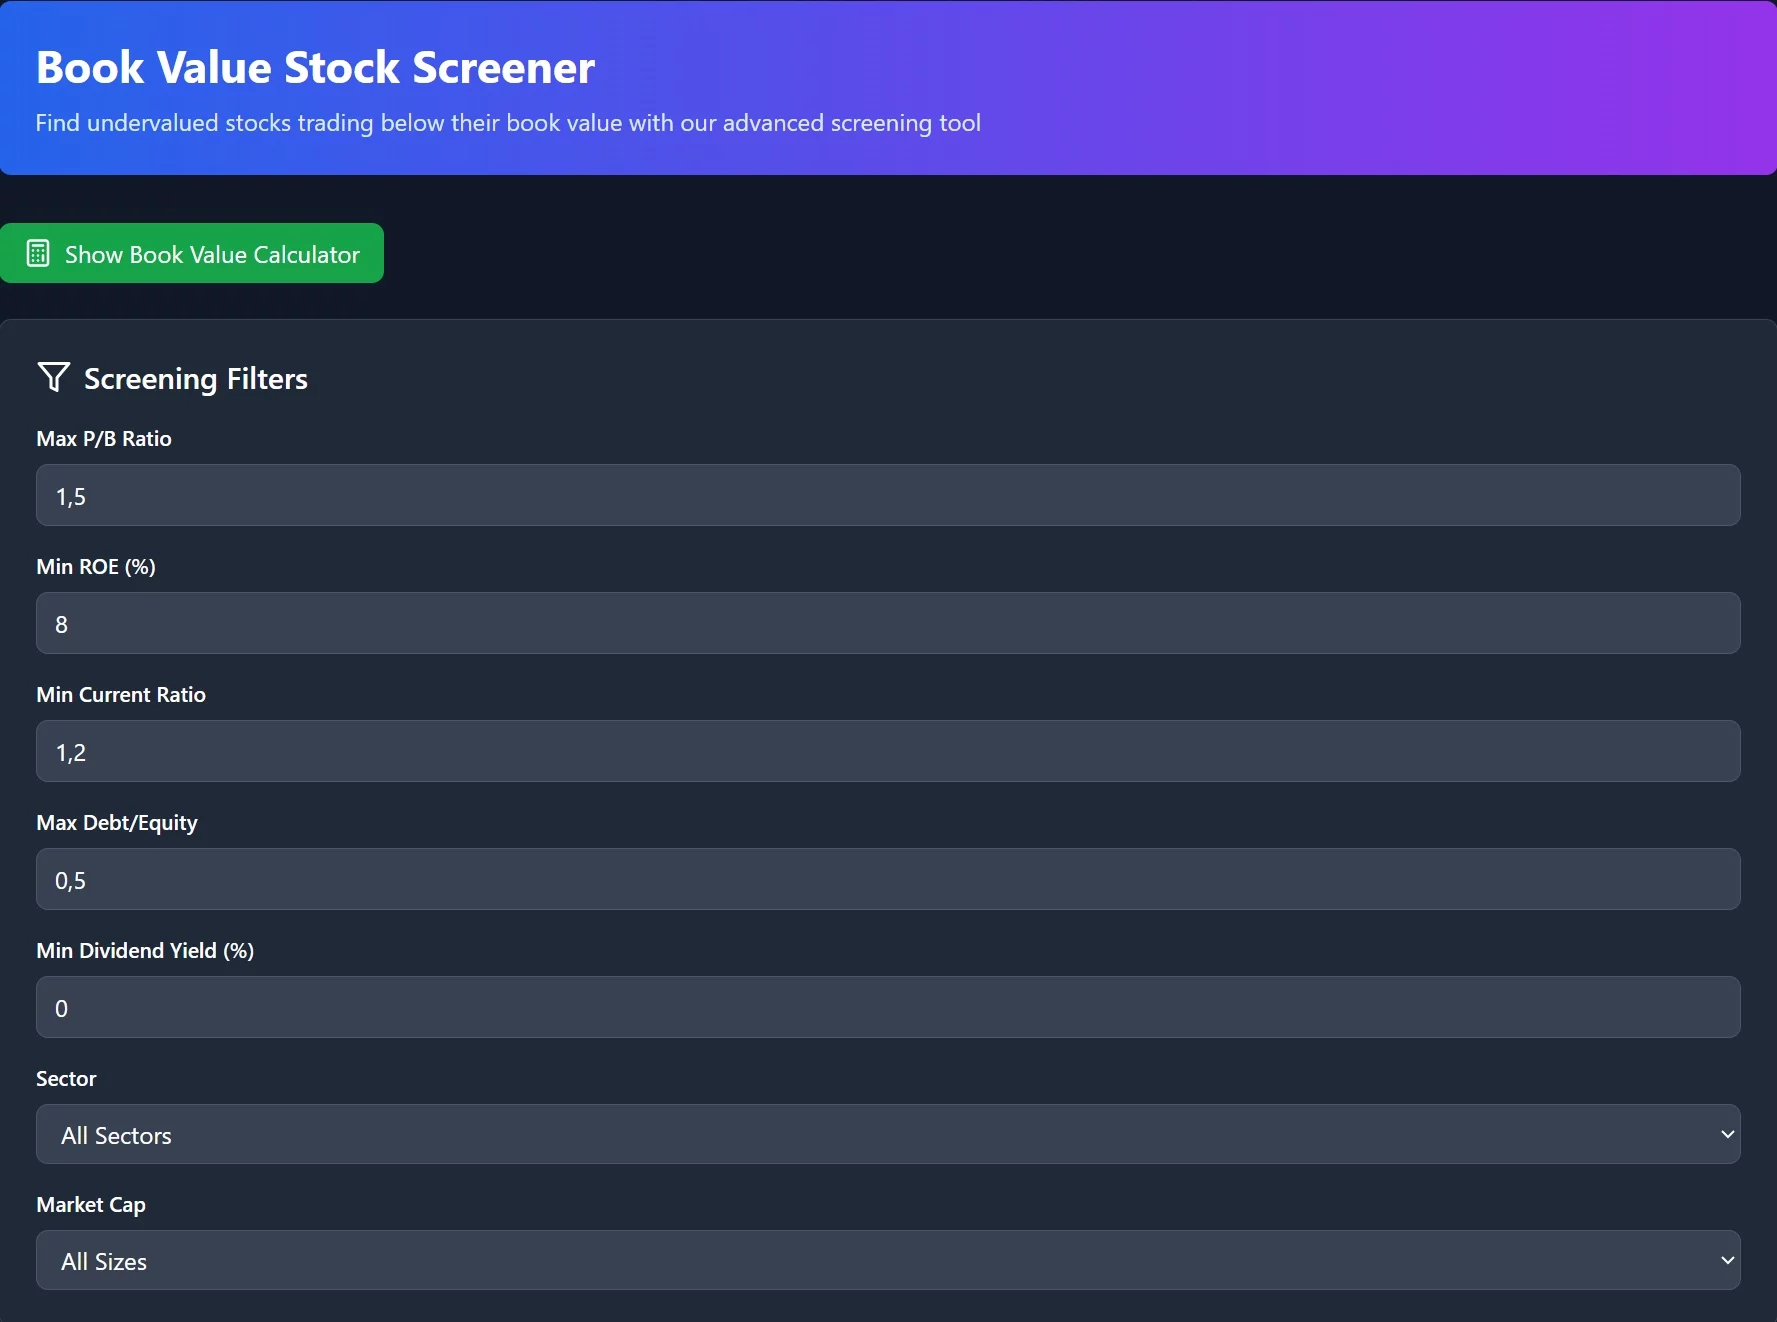
I began trading in 2015 and started coaching in 2019. Book value trading represents one of the most reliable strategies for long-term wealth building. However, many investors misunderstand this fundamental approach completely. Therefore, this guide helps you master book value analysis for consistent market outperformance. 👉 In this guide, you will learn: Book value provides a concrete foundation for investment decisions. Unfortunately, growth stock hype often overshadows this time-tested approach. Additionally, understanding book value separates serious investors from speculators completely. …

Hold a Master Degree in Electrical engineering from Texas A&M University.
African born – French Raised and US matured who speak 5 languages.
Active Stock Options Trader and Coach since 2014.
Most Swing Trade weekly Options and Specialize in 10-Baggers !
YouTube Channel: https://www.youtube.com/c/SuccessfulTradings
Other Website: https://237answersblog.com/