I began trading in 2015 and started coaching in 2019. All-time highs create both tremendous opportunities and dangerous traps for traders. However, many investors avoid markets during peak periods and miss substantial profits. Therefore, this guide reveals how to trade successfully when stocks reach unprecedented levels.
👉 In this guide, you will learn:
- 🚨 Why all-time highs actually present excellent trading opportunities
- 📈 Specific trading strategies that work during market peaks
- 💰 Risk management techniques for high-altitude trading
- 🎯 How to identify which stocks to trade during ATH periods
- 🧠 Psychology of trading when everyone fears market crashes
- 📊 Technical indicators that remain reliable at market highs
- ⚖️ Portfolio allocation strategies for peak market periods
All-time highs trigger fear in most investors despite representing optimal trading conditions. Additionally, media narratives about “overvaluation” create panic selling opportunities. Furthermore, professional traders systematically exploit retail investor anxiety during these periods.
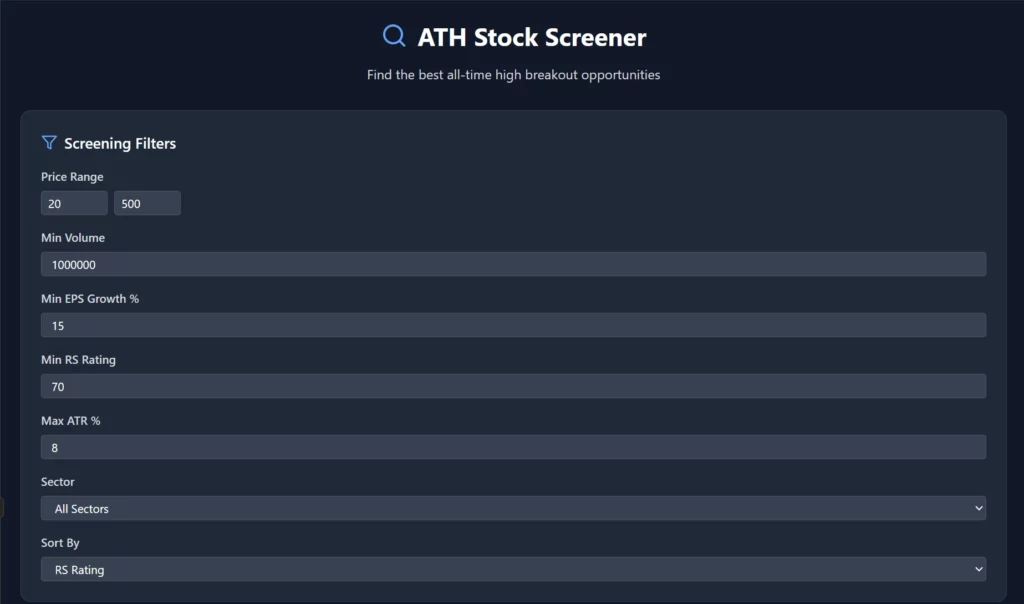
Table of Contents
The All-Time High Advantage 📈
Contrary to popular belief, all-time highs signal strength rather than weakness. Strong stocks reaching new peaks often continue climbing for extended periods. Moreover, momentum strategies prove most profitable during these conditions.
Why ATH Trading Works
Momentum Continuation Patterns Stocks breaking to new highs demonstrate institutional accumulation and strong fundamentals. Furthermore, technical breakouts from consolidation patterns create powerful momentum. Additionally, buying interest typically increases as stocks reach uncharted territory.
Key reasons ATH trading succeeds:
- 💪 Strong institutional buying drives price discovery higher
- 📊 Technical resistance levels disappear above previous peaks
- 🚀 Momentum traders create self-reinforcing price action
- 💰 Fear of missing out (FOMO) attracts additional buying
- 📈 Media attention increases retail investor participation
Historical Performance Data Research consistently shows that stocks at all-time highs outperform over subsequent 6-12 month periods. Moreover, markets spend surprisingly little time at previous peak levels. Additionally, successful companies naturally create new highs regularly.
Statistical advantages of ATH trading:
- 📊 60-70% of stocks at ATH continue higher within 6 months
- 📊 Average returns exceed 15% for ATH stocks vs. 8% for market
- 📊 Markets spend only 5% of time within 5% of previous highs
- 📊 Bull markets create consistent series of higher highs
However, ATH trading requires discipline and systematic approaches rather than emotional reactions. Furthermore, proper risk management becomes essential as volatility often increases.
ATH Trading Strategy Framework 🎯
Successful ATH trading combines technical analysis with fundamental strength assessment. Moreover, systematic approaches eliminate emotional decision-making that destroys profits. Additionally, position sizing must account for increased volatility at market peaks.
The BREAKOUT Method
B – Base Building Identification Look for stocks that consolidated for 4-8 weeks before breaking higher. Furthermore, tight consolidation patterns indicate institutional accumulation. Additionally, volume should decrease during consolidation and spike during breakout.
Base building characteristics:
- 📊 4-8 week consolidation in tight trading range
- 📊 Volume contraction during base formation
- 📊 Multiple tests of resistance level
- 📊 Volume explosion on breakout above resistance
R – Relative Strength Analysis Compare stock performance to broader market indices during recent periods. Strong stocks outperform during market weakness and accelerate during strength. Moreover, relative strength rankings help identify leaders.
Relative strength evaluation:
- 📈 Stock up 20%+ while market flat or down
- 📈 RS rating above 80 on scale of 1-100
- 📈 Price above 50-day and 200-day moving averages
- 📈 Stock leads sector and market higher consistently
E – Earnings Growth Verification All-time high stocks must demonstrate fundamental justification for higher prices. Therefore, earnings growth acceleration often precedes major price moves. Additionally, revenue growth should support earnings expansion.
Earnings criteria for ATH trades:
- 💰 EPS growth accelerating for 2+ consecutive quarters
- 💰 Revenue growth supporting earnings expansion
- 💰 Profit margins stable or improving
- 💰 Guidance raises or analyst upgrades
A – Accumulation Evidence Institutional buying creates the foundation for sustained moves higher. Smart money accumulation appears through subtle volume and price patterns. Furthermore, accumulation often occurs below the radar.
Accumulation indicators:
- 📊 Volume spikes on up days exceed down day volume
- 📊 Price closes in upper portion of daily ranges
- 📊 Options flow shows calls exceeding puts significantly
- 📊 Float reduction through buybacks or insider buying
Risk Management at Market Peaks ⚖️
All-time high trading requires enhanced risk management due to increased volatility. Moreover, position sizing must account for potential rapid reversals. Additionally, mental stop levels become crucial for capital preservation.
Position Sizing for ATH Trading
The 2% Rule Enhanced Risk maximum 2% of portfolio capital on any single ATH trade. However, consider reducing to 1% if overall portfolio concentration exceeds normal levels. Furthermore, aggregate ATH exposure should remain under 20% of total capital.
Position sizing calculations:
- 💰 Account size × 2% = maximum risk per trade
- 💰 Entry price – stop loss = risk per share
- 💰 Maximum risk ÷ risk per share = position size
- 💰 Adjust for overall portfolio beta and correlation
Volatility Adjustment Formula All-time high stocks often exhibit higher volatility requiring position size reductions. Therefore, multiply normal position size by volatility adjustment factor. Additionally, consider correlation between multiple ATH positions.
Volatility adjustment guidelines:
- 📊 Low volatility (ATR < 3%): Normal position size
- 📊 Medium volatility (ATR 3-5%): Reduce by 25%
- 📊 High volatility (ATR > 5%): Reduce by 50%
- 📊 Multiple correlated positions: Additional 25% reduction
Stop Loss Strategies
Technical Stop Placement Place stops below significant technical levels rather than arbitrary percentages. Furthermore, consider average true range when setting stop distances. Additionally, market structure should influence stop placement decisions.
Technical stop guidelines:
- 📉 Below consolidation low for breakout trades
- 📉 Below 10-day moving average for momentum plays
- 📉 Below significant volume cluster on profile
- 📉 Minimum 1.5x ATR below entry for breathing room
Time-Based Stops All-time high trades should show progress within reasonable timeframes. Moreover, failing trades often continue failing regardless of technical levels. Additionally, opportunity cost considerations justify time stops.
Time stop implementation:
- ⏰ Exit if no progress after 5-10 trading days
- ⏰ Reduce position if sideways for 2 weeks
- ⏰ Complete exit if negative after 1 month
- ⏰ Consider market environment in timing decisions
Stock Selection for ATH Trading 📊
Not all stocks reaching new highs merit trading consideration. Therefore, systematic screening helps identify highest probability setups. Furthermore, fundamental and technical filters eliminate weaker candidates.
Fundamental Screening Criteria
Growth Metrics Focus on companies demonstrating accelerating growth in key metrics. Consistent growth attracts institutional investment driving sustained price appreciation. Moreover, growth stocks justify premium valuations better.
Essential growth characteristics:
- 📈 EPS growth acceleration for 2+ consecutive quarters
- 📈 Revenue growth exceeding 15% annually
- 📈 ROE improving and above industry average
- 📈 Debt-to-equity ratio reasonable for sector
Market Leadership Indicators Seek companies leading their industries in innovation, market share, or financial performance. Industry leaders typically outperform during bull markets. Additionally, dominant companies often trade at premium multiples.
Leadership evaluation factors:
- 🏆 Market share gains in growing industries
- 🏆 Product innovation and competitive advantages
- 🏆 Superior margins compared to competitors
- 🏆 Strong brand recognition and customer loyalty
Technical Screening Parameters
Volume Confirmation All-time high breakouts require volume confirmation to validate institutional participation. Moreover, volume should exceed 50% of average on breakout day. Additionally, sustained volume suggests continued interest.
Volume analysis requirements:
- 📊 Breakout volume > 150% of 50-day average
- 📊 Above-average volume for 3 of past 5 days
- 📊 Volume leads price on strong up days
- 📊 Accumulation/distribution line trending higher
Price Action Quality Evaluate how stocks approach all-time highs for clues about future performance. Clean, powerful moves suggest institutional involvement. Furthermore, choppy action indicates retail-driven moves.
Quality price action signals:
- ⬆️ Strong closes near daily highs consistently
- ⬆️ Minimal overlap between daily ranges
- ⬆️ Higher lows maintained during pullbacks
- ⬆️ Price gaps up on earnings or news
Psychology of ATH Trading 🧠
Mental approach determines success more than technical skills when trading all-time highs. Fear of buying peaks causes missed opportunities while greed leads to excessive risk-taking. Moreover, media narratives create emotional interference.
Overcoming Peak-Buying Fear
Reframe the Narrative All-time highs represent strength, not weakness, for properly selected stocks. Furthermore, the best stocks often trade at new highs for months. Additionally, waiting for pullbacks in strong trends causes missed profits.
Mental reframing techniques:
- 🧠 View ATH as confirmation of strength, not warning
- 🧠 Remember that strong stocks stay strong longer
- 🧠 Focus on momentum rather than valuation concerns
- 🧠 Trust systematic approach over emotional reactions
Historical Perspective Study historical examples of successful ATH trades to build confidence. Amazon, Apple, and Microsoft created life-changing wealth for investors who bought at successive all-time highs. Moreover, the best performers often seem “expensive” initially.
Historical ATH success examples:
- 📈 Apple: Multiple 100%+ gains from ATH purchases
- 📈 Amazon: 20+ year trend of making new highs
- 📈 Microsoft: Cloud transition drove sustained ATH series
- 📈 Tesla: EV adoption cycle created massive ATH gains
Managing FOMO and Greed
Systematic Entry Rules Establish clear criteria for ATH entries to prevent emotional decision-making. Furthermore, only trade setups meeting all requirements regardless of market excitement. Additionally, avoid chasing extended moves without proper base building.
Entry discipline checklist:
- ✅ All fundamental criteria met completely
- ✅ Technical setup matches historical patterns
- ✅ Position size calculated based on risk parameters
- ✅ Clear exit strategy defined before entry
Profit-Taking Discipline All-time high trades often generate substantial profits quickly. However, greed can turn winning trades into losses. Therefore, systematic profit-taking ensures capital preservation and compound growth.
Profit management strategies:
- 💰 Take 1/3 profits at 20% gain level
- 💰 Trail stops higher as momentum continues
- 💰 Exit completely on first sign of distribution
- 💰 Never let winners become losers
Technical Indicators for ATH Trading 📊
Traditional indicators require modification for all-time high conditions. Moreover, some indicators become more reliable while others lose effectiveness. Additionally, momentum indicators gain importance over mean reversion signals.
Most Reliable ATH Indicators
Relative Strength Index (RSI) Modified Standard RSI overbought signals (>70) become bullish during strong trends. Furthermore, RSI holding above 40 on pullbacks indicates continued strength. Additionally, RSI divergences remain valid warning signals.
ATH RSI interpretation:
- 📊 RSI >70: Bullish in uptrends, not overbought warning
- 📊 RSI >40 on pullbacks: Strength confirmation
- 📊 RSI <30: Potential reversal or deeper correction
- 📊 Negative divergence: Valid warning signal
Moving Average Analysis Price relationship to moving averages provides trend context. Stocks above rising moving averages maintain bullish bias. Moreover, moving average support levels guide stop placement.
ATH moving average signals:
- 📈 Price >10, 20, 50-day MA: Strong uptrend intact
- 📈 Rising moving averages: Bullish momentum continues
- 📈 MA support holds: Continuation pattern likely
- 📈 MA breakdown: Trend reversal possible
Indicators to Avoid at ATH
Traditional Overbought Signals Mean reversion indicators frequently fail during strong momentum periods. Moreover, overbought conditions can persist much longer than expected. Additionally, these signals cause premature exits from profitable trades.
Problematic indicators during ATH:
- ❌ Stochastics overbought signals
- ❌ Williams %R extreme readings
- ❌ Bollinger Band upper band touches
- ❌ Traditional support/resistance levels
Market Environment Assessment 🌍
All-time high trading success depends heavily on overall market conditions. Bull markets create ideal conditions while bear markets make ATH trades extremely risky. Moreover, sector rotation affects individual stock performance.
Bull Market Confirmation
Breadth Analysis Strong bull markets demonstrate broad participation across sectors and market caps. Furthermore, advance/decline ratios should confirm price moves higher. Additionally, new high/new low ratios provide market health insights.
Bull market breadth indicators:
- 📊 Advance/decline line making new highs
- 📊 New highs expanding across sectors
- 📊 Small caps participating in upward moves
- 📊 High-beta stocks leading advances
Sector Leadership Growth sectors typically lead during bull markets while defensive sectors lag. Technology, consumer discretionary, and financials often outperform. Moreover, sector rotation provides early warning of trend changes.
Bull market sector patterns:
- 🚀 Technology leading with strong earnings growth
- 🚀 Consumer discretionary showing spending confidence
- 🚀 Financials benefiting from rising rates/strong economy
- 🚀 Defensive sectors (utilities, staples) lagging
Risk-Off Environment Recognition
VIX Analysis Volatility index levels provide market fear/greed insights. Furthermore, VIX spikes often create excellent buying opportunities. Additionally, persistently low VIX suggests complacent conditions.
VIX interpretation for ATH trading:
- 📊 VIX <15: Complacent conditions, be selective
- 📊 VIX 15-25: Normal conditions, standard approach
- 📊 VIX >25: Elevated fear, avoid new positions
- 📊 VIX spikes >40: Potential capitulation buying opportunities
Case Studies: Successful ATH Trades 📈
Real examples demonstrate how ATH trading principles work in practice. Moreover, studying successful trades builds pattern recognition skills. Additionally, learning from both winners and losers improves future performance.
Case Study 1: NVIDIA 2023 AI Breakout
Setup Analysis NVIDIA broke to all-time highs in May 2023 after strong quarterly earnings. Furthermore, AI narrative provided fundamental catalyst for institutional buying. Additionally, technical breakout occurred from multi-month base.
Trade execution details:
- 📊 Entry: $387 breakout above $380 resistance
- 📊 Stop: $350 below consolidation support
- 📊 Target: $500+ based on measured move
- 📊 Result: 300%+ gain over 6 months
Key Success Factors Strong fundamental catalyst (AI adoption) provided buying conviction. Technical breakout with volume confirmed institutional participation. Moreover, patience during base building allowed optimal entry timing.
Case Study 2: Tesla 2020 EV Revolution
Setup Analysis Tesla reached multiple all-time highs throughout 2020 as EV adoption accelerated. Each consolidation created new buying opportunities for momentum traders. Furthermore, fundamental story strengthened with profitability achievement.
Trading approach:
- 📊 Multiple entries at successive ATH breakouts
- 📊 Position sizing scaled with trend strength
- 📊 Profits taken systematically on extensions
- 📊 Total return: 740% from initial entry
Learning Points Strong secular trends create multiple ATH trading opportunities. Systematic scaling into momentum proves more profitable than single large positions. Moreover, fundamental transformation justified premium valuation.
Common ATH Trading Mistakes 🚨
Understanding typical errors helps avoid costly mistakes when trading all-time highs. Furthermore, these mistakes often result from emotional decision-making rather than systematic approaches. Additionally, recognizing these patterns improves future performance.
Entry Timing Errors
Chasing Extended Moves Many traders buy stocks after they’ve already moved significantly higher. However, risk-reward ratios deteriorate as distance from base increases. Moreover, late entries often coincide with short-term tops.
Entry timing guidelines:
- ✅ Buy within 5-10% of proper breakout point
- ❌ Avoid entries >20% extended from base
- ✅ Wait for pullback if missed initial breakout
- ❌ Never chase intraday momentum without setup
Base Building Patience Successful ATH trading requires patience for proper setup development. Many traders enter too early during base building rather than waiting for confirmation. Furthermore, premature entries often result in whipsaws.
Risk Management Failures
Position Sizing Errors All-time high euphoria often leads to oversized positions. However, increased volatility at market peaks requires smaller position sizes. Moreover, multiple ATH positions create dangerous correlation exposure.
Stop Loss Neglect Strong momentum can create false confidence leading to stop loss removal. Furthermore, ego prevents accepting losses when trades move against positions. Additionally, hope often replaces systematic exit strategies.
Advanced ATH Trading Techniques 🎯
Experienced traders can employ sophisticated strategies to enhance ATH trading results. Moreover, these techniques require substantial experience and risk management discipline. Additionally, advanced strategies often involve options or derivatives.
Options Strategies for ATH
Long Call Options Call options provide leveraged exposure to ATH breakouts with limited risk. Furthermore, time decay requires careful timing and quick decisions. Additionally, implied volatility affects option pricing significantly.
ATH call option guidelines:
- 📊 Buy calls with 60-90 days to expiration
- 📊 Choose strikes near-the-money for best delta
- 📊 Target 50-100% profits quickly
- 📊 Exit by 30 days to expiration
Call Spreads Bull call spreads reduce cost while limiting upside in exchange for higher probability. Moreover, spreads perform better in sideways or modest up moves. Additionally, defined risk makes position sizing easier.
Pairs Trading at ATH
Long/Short Sector Pairs Trade the strongest stock long against the weakest short within same sector. This approach reduces market risk while capturing relative performance differences. Moreover, pairs trading works well during high correlation periods.
Sector pairs criteria:
- 📊 Both stocks at extremes of relative strength
- 📊 Similar market caps and liquidity
- 📊 Fundamental differences justify performance gap
- 📊 Technical setups aligned with pair direction
Conclusion
All-time highs represent exceptional trading opportunities rather than danger signals for prepared traders. Systematic approaches that combine fundamental strength with technical breakouts generate superior returns. Moreover, proper risk management prevents the devastating losses that destroy trading careers.
Success requires overcoming psychological barriers that prevent buying strength. Furthermore, historical analysis proves that the strongest stocks continue making new highs for extended periods. Additionally, institutional money consistently drives the best performers to successive peaks.
Remember that the biggest winners often seem overvalued initially but continue advancing due to superior business fundamentals. Therefore, focus on momentum and relative strength rather than traditional valuation metrics when trading all-time highs.
Finally, consistent application of systematic rules eliminates emotional decision-making that turns winning strategies into losing ones.
👉 Next Read: How to trade stocks near book value

Hold a Master Degree in Electrical engineering from Texas A&M University.
African born – French Raised and US matured who speak 5 languages.
Active Stock Options Trader and Coach since 2014.
Most Swing Trade weekly Options and Specialize in 10-Baggers !
YouTube Channel: https://www.youtube.com/c/SuccessfulTradings
Other Website: https://237answersblog.com/