I began trading in 2015 and started coaching in 2019. Breakout trading represents one of the most profitable strategies for capturing explosive stock moves. However, false breakouts destroy more accounts than any other trading mistake. Therefore, this guide reveals how to identify genuine breakouts and maximize profits while avoiding costly traps.
👉 In this guide, you will learn:
- 🚀 How to identify high-probability breakout setups before they occur
- 📊 Technical patterns that consistently produce profitable breakout trades
- 💰 Entry timing strategies that maximize reward while minimizing risk
- 🎯 Volume analysis techniques for confirming breakout authenticity
- 🧠 Psychology behind successful breakout trading execution
- ⚖️ Risk management systems specifically designed for breakout trades
- 📈 Post-breakout management strategies for maximum profit extraction
Breakout trading attracts novice traders due to its apparent simplicity and profit potential. Additionally, social media showcases spectacular breakout gains without revealing the numerous failures. Furthermore, most retail traders enter breakouts too late or with improper risk management.
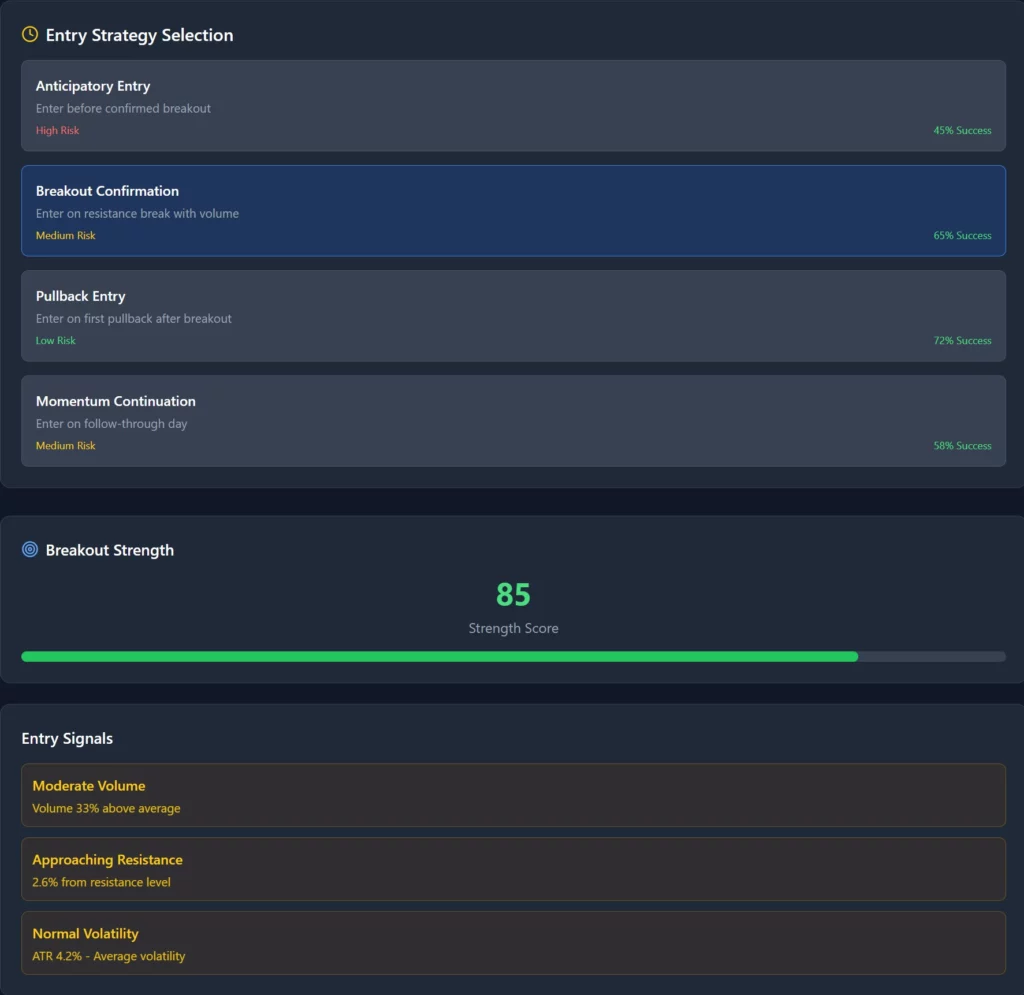
Table of Contents
Understanding Breakout Dynamics 📈
Breakouts occur when stocks move beyond established resistance levels with conviction. Strong institutional buying typically drives authentic breakouts while retail speculation creates false moves. Moreover, genuine breakouts often continue much further than initial targets suggest.
The Anatomy of True Breakouts
Accumulation Phase Development Before breaking out, stocks typically consolidate in bases for several weeks or months. During this period, smart money accumulates shares while retail investors lose interest. Furthermore, volume contracts as fewer participants trade within the established range.
Key accumulation characteristics:
- 📊 4-12 week consolidation in tight trading ranges
- 📊 Volume contraction during base formation periods
- 📊 Multiple tests of resistance without breakdown
- 📊 Price closes consistently in upper half of ranges
- 📊 Institutional ownership increases during quiet periods
Catalyst Development Successful breakouts require fundamental catalysts that justify higher stock prices. Earnings growth acceleration often provides the strongest catalyst for sustainable moves. Additionally, new product launches or market expansion create compelling growth narratives.
Common breakout catalysts include:
- 💡 Earnings surprises with raised guidance
- 💡 New product launches in large markets
- 💡 Strategic partnerships or acquisitions
- 💡 Market share gains in growing industries
- 💡 Regulatory approvals for key initiatives
Volume Confirmation Patterns Authentic breakouts demonstrate institutional participation through distinctive volume patterns. Furthermore, volume should expand significantly on the breakout day compared to recent averages. Additionally, sustained volume suggests continued institutional interest.
Volume confirmation signals:
- 🔊 Breakout volume exceeds 150% of 50-day average
- 🔊 Above-average volume for multiple consecutive days
- 🔊 Volume leads price action on strong up moves
- 🔊 Accumulation/distribution line trending consistently higher
The BREAKOUT Trading Framework 🎯
Systematic approaches eliminate emotional decision-making that destroys breakout trading profits. Moreover, frameworks provide consistent criteria for entry and exit decisions. Additionally, structured methods help identify the highest probability setups.
The POWER Method
P – Pattern Recognition Identify stocks forming constructive chart patterns near resistance levels. Furthermore, certain patterns have higher success rates than others historically. Additionally, pattern quality affects potential move magnitude significantly.
High-probability breakout patterns:
- 📊 Cup and handle formations with tight handles
- 📊 Flat bases with multiple resistance tests
- 📊 Ascending triangles with rising support
- 📊 Pennant formations following strong advances
- 📊 Double bottom patterns with strong rebounds
O – Overhead Supply Analysis Evaluate potential selling pressure above current resistance levels. Heavy overhead supply can limit breakout potential even with strong fundamentals. Moreover, clear sailing above resistance suggests stronger move potential.
Supply analysis factors:
- 📈 Previous high volume areas creating potential resistance
- 📈 Moving average clusters that may provide selling
- 📈 Round number psychological resistance levels
- 📈 Gap areas from previous earnings reactions
- 📈 Fibonacci retracement levels from prior declines
W – Window of Opportunity Timing breakout entries requires patience for optimal risk-reward setups. Furthermore, entering too early results in sideways action and opportunity cost. Additionally, late entries often occur at temporary tops.
Optimal entry timing indicators:
- ⏰ Volume expansion preceding price breakout
- ⏰ Multiple days of tight price action near resistance
- ⏰ Relative strength improvement versus market indices
- ⏰ Options activity favoring calls over puts significantly
- ⏰ Fundamental catalyst announcement pending
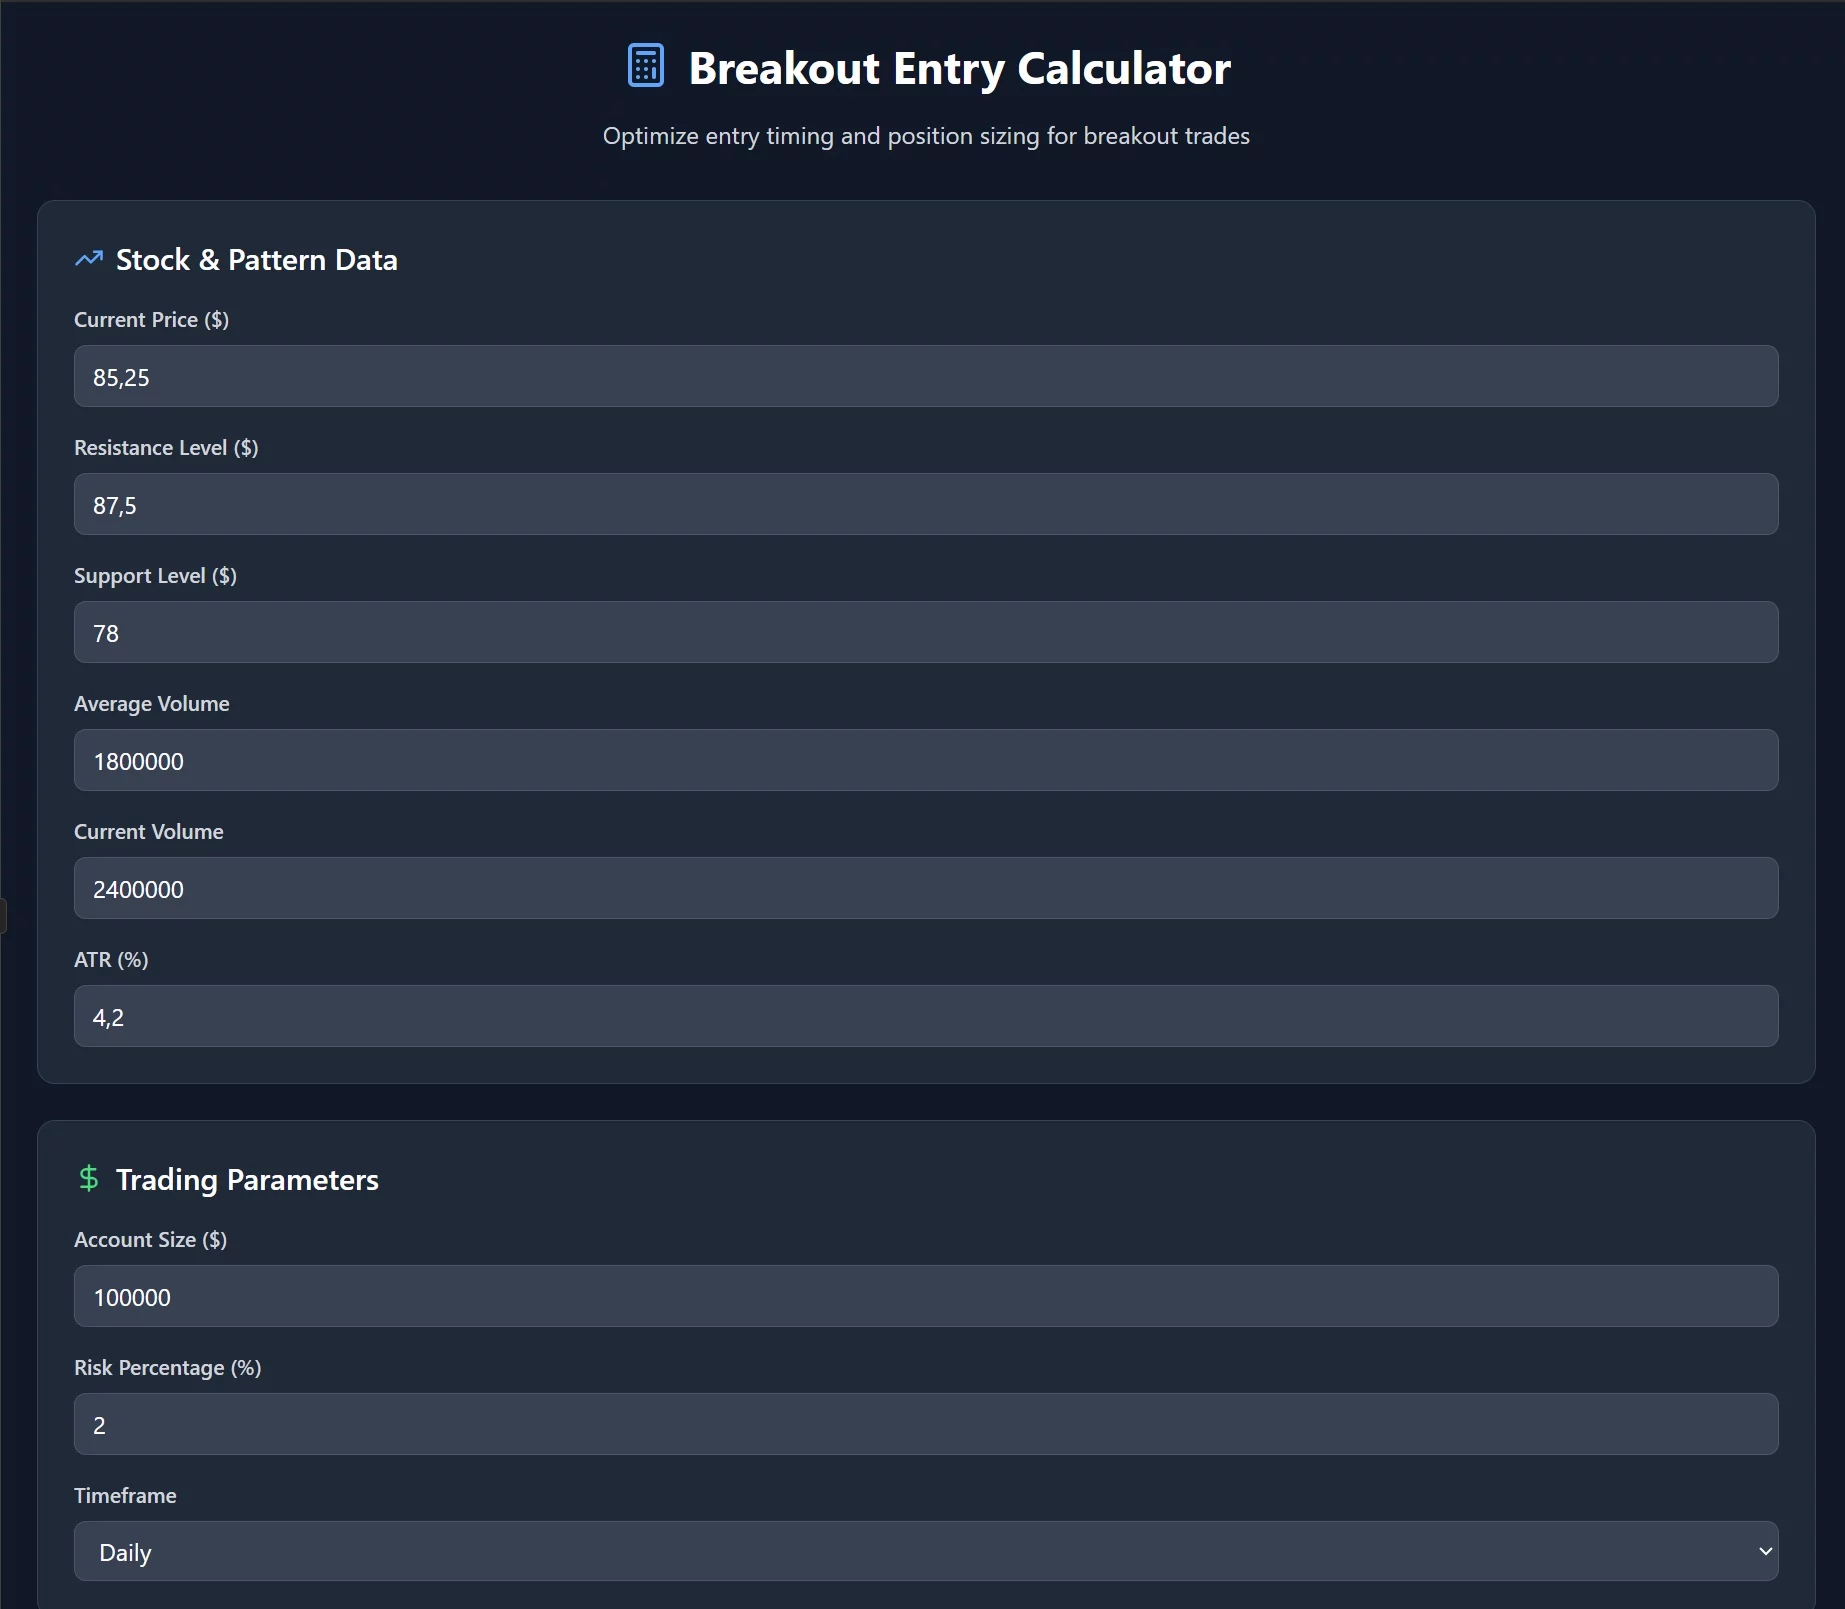
E – Entry Execution Strategy Execute breakout entries with precision to optimize risk-reward ratios. Aggressive entries capture more of the move but increase false breakout risk. Meanwhile, conservative entries provide confirmation but reduce profit potential.
Entry execution approaches:
- 🎯 Anticipatory entry: Buy before breakout on volume expansion
- 🎯 Breakout entry: Buy on initial move above resistance
- 🎯 Pullback entry: Buy first pullback after confirmed breakout
- 🎯 Momentum entry: Buy on acceleration after initial breakout
R – Risk Management Implementation Position sizing and stop placement determine breakout trading success more than entry timing. Furthermore, breakout trades often move quickly requiring predetermined risk parameters. Additionally, emotional decision-making during rapid moves destroys accounts.
Risk management essentials:
- 💰 Risk maximum 2-3% of account per breakout trade
- 💰 Place stops below consolidation low or moving averages
- 💰 Use technical levels rather than percentage-based stops
- 💰 Reduce position size if multiple breakouts correlated
Pre-Breakout Analysis Techniques 📊
Identifying potential breakouts before they occur provides optimal risk-reward opportunities. Moreover, early identification allows for patient entry execution and better position sizing. Additionally, anticipating moves reduces chasing extended stocks.
Technical Setup Evaluation
Base Quality Assessment High-quality bases demonstrate controlled selling and institutional accumulation. Furthermore, base length affects potential breakout magnitude with longer bases often producing larger moves. Additionally, base depth influences breakout sustainability.
Quality base characteristics:
- 📊 4-12 week consolidation timeframe optimal
- 📊 Maximum 20-25% correction from highs
- 📊 Tight weekly closes in final weeks
- 📊 Support holding at logical technical levels
- 📊 Constructive price action during market weakness
Relative Strength Analysis Compare stock performance to market indices during base formation periods. Strong stocks outperform during market weakness and lead during strength. Moreover, relative strength rankings help prioritize trading candidates.
RS evaluation criteria:
- 📈 Stock up while market flat or declining
- 📈 RS rating above 70 on 1-100 scale
- 📈 Price above key moving averages consistently
- 📈 Sector leadership during recent periods
- 📈 New highs relative to broader market performance
Volume Pattern Recognition Study volume patterns during base formation for clues about institutional activity. Additionally, volume expansion often precedes price breakouts by several days. Furthermore, distinctive volume signatures improve breakout prediction accuracy.
Volume pattern analysis:
- 🔊 Drying up volume during consolidation
- 🔊 Volume spikes on any upward price movement
- 🔊 Above-average volume on strong closes
- 🔊 Accumulation patterns in volume indicators
- 🔊 Institutional block trading activity
Fundamental Strength Verification
Growth Metrics Analysis Breakout candidates should demonstrate accelerating growth in key financial metrics. Furthermore, consistent growth attracts institutional investment that drives sustained moves. Additionally, growth stocks justify premium valuations during expansion periods.
Essential growth characteristics:
- 💰 EPS growth accelerating for 2+ quarters
- 💰 Revenue growth exceeding industry averages
- 💰 Profit margins stable or expanding
- 💰 Return on equity improving consistently
- 💰 Debt levels reasonable for growth rate
Market Position Evaluation Seek companies with strengthening competitive positions in growing markets. Industry leaders typically outperform during bull markets. Moreover, companies gaining market share command premium valuations.
Competitive position factors:
- 🏆 Market share gains in expanding industries
- 🏆 Product differentiation and pricing power
- 🏆 Brand recognition and customer loyalty
- 🏆 Competitive moats protecting market position
- 🏆 Innovation pipeline supporting future growth
Breakout Entry Strategies ⚡
Different entry approaches suit varying risk tolerances and market conditions. Moreover, entry timing significantly impacts overall trade profitability. Additionally, systematic entry rules eliminate emotional decision-making during critical moments.
The Three-Tier Entry System
Tier 1: Anticipatory Entries Enter positions before confirmed breakouts when multiple setup criteria align. This approach captures the most profit but requires accepting higher false breakout risk. Furthermore, anticipatory entries demand strict stop loss discipline.
Anticipatory entry triggers:
- 🎯 Volume expansion near resistance levels
- 🎯 Tight price action suggesting coiling energy
- 🎯 Positive earnings surprise or guidance raise
- 🎯 Sector strength with stock lagging initially
- 🎯 Options activity favoring upside significantly
Tier 2: Breakout Confirmation Entries Buy stocks as they clear resistance levels with volume confirmation. Additionally, this approach balances profit potential with breakout authenticity. Furthermore, confirmation entries reduce false breakout exposure.
Confirmation entry criteria:
- ⚡ Price closes above resistance on expanded volume
- ⚡ Intraday strength maintains throughout session
- ⚡ Gap up opening followed by continuation
- ⚡ Multiple time frame alignment showing strength
- ⚡ Sector participation supporting individual move
Tier 3: Momentum Continuation Entries Enter after initial breakout demonstrates sustainability through follow-through action. This conservative approach provides highest probability but captures less total profit. Moreover, momentum entries work best in strong trending markets.
Momentum entry signals:
- 🚀 Second day of progress after initial breakout
- 🚀 Pullback to breakout level holds support
- 🚀 Higher highs and higher lows established
- 🚀 Volume remaining above average consistently
- 🚀 Relative strength continuing versus indices
Volume Analysis for Breakout Trading 📊
Volume provides the most reliable confirmation of breakout authenticity. Furthermore, distinctive volume patterns help distinguish genuine moves from false signals. Additionally, volume analysis guides position sizing and holding period decisions.
Critical Volume Patterns
Expansion Volume Breakouts Authentic breakouts typically show volume expansion of 50-100% above recent averages. Furthermore, sustained volume suggests continued institutional participation. Additionally, volume leadership often precedes price leadership.
Expansion volume characteristics:
- 🔊 Breakout day volume 150%+ of 50-day average
- 🔊 Multiple days of above-average participation
- 🔊 Volume expansion preceding price breakout
- 🔊 Institutional block size transactions increasing
- 🔊 Options volume favoring calls over puts
Climactic Volume Patterns Some breakouts occur on extremely high volume representing climactic buying. However, these moves often reverse quickly as buying exhausts itself. Therefore, climactic volume requires careful interpretation and quick profit-taking.
Managing climactic breakouts:
- ⚠️ Volume 300%+ above average may indicate climax
- ⚠️ Parabolic price advance with media attention
- ⚠️ Retail investor excitement reaching extreme levels
- ⚠️ Take profits quickly on climactic patterns
- ⚠️ Avoid holding through potential exhaustion
Accumulation Volume Analysis Study volume patterns during base formation for institutional accumulation evidence. Smart money often accumulates quietly before major moves. Moreover, accumulation patterns provide confidence for breakout trade execution.
Accumulation indicators:
- 📈 Volume higher on up days versus down days
- 📈 Price closes in upper portion of daily ranges
- 📈 Large block transactions on price strength
- 📈 Volume dry-up during price weakness
- 📈 Accumulation/distribution line trending higher
Risk Management for Breakout Trades ⚖️
Breakout trading requires enhanced risk management due to high failure rates and volatile price action. Moreover, position sizing must account for increased volatility around breakout levels. Additionally, stop placement determines trade success more than entry timing.
Position Sizing for Breakouts
The 2% Rule Modified Risk maximum 2% of account value on any single breakout trade. However, reduce position size when trading multiple correlated breakouts simultaneously. Furthermore, consider increasing position size for highest confidence setups.
Position sizing calculations:
- 💰 Account size × 2% = maximum risk per trade
- 💰 Entry price – stop loss = risk per share
- 💰 Maximum risk ÷ risk per share = position size
- 💰 Adjust for correlation and volatility factors
Volatility-Adjusted Sizing Breakout stocks often exhibit higher volatility requiring position size adjustments. Therefore, use average true range (ATR) to modify normal position sizing. Additionally, consider recent price action when determining appropriate size.
Volatility adjustment guidelines:
- 📊 ATR < 3%: Normal position size acceptable
- 📊 ATR 3-5%: Reduce position by 25%
- 📊 ATR 5-7%: Reduce position by 40%
- 📊 ATR > 7%: Reduce position by 50% or avoid
Stop Loss Placement Strategies
Technical Stop Levels Place stops below significant technical support levels rather than arbitrary percentages. Furthermore, consider average true range when determining stop distance. Additionally, respect major moving averages as logical stop areas.
Technical stop guidelines:
- 📉 Below consolidation low for base breakouts
- 📉 Below 10-day or 20-day moving average
- 📉 Below previous swing low or support area
- 📉 Minimum 1.5x ATR below entry for breathing room
- 📉 Round numbers often provide psychological support
Time-Based Stop Management Breakout trades should demonstrate progress within reasonable timeframes. Moreover, stagnant trades tie up capital and create opportunity costs. Additionally, failed breakouts often continue deteriorating.
Time stop implementation:
- ⏰ Exit if no progress after 5-7 trading days
- ⏰ Reduce position if sideways for 2 weeks
- ⏰ Complete exit if negative after 3 weeks
- ⏰ Consider market environment in timing decisions
- ⏰ Faster time stops during weak market conditions
Psychology of Breakout Trading 🧠
Mental approach determines breakout trading success more than technical analysis skills. Fear of missing out leads to chasing extended moves while fear of loss causes premature exits. Moreover, emotional decision-making turns winning strategies into losing ones.
Overcoming FOMO and Impulse Trading
Systematic Entry Discipline Establish clear criteria for breakout entries to prevent emotional decision-making. Furthermore, only trade setups meeting all requirements regardless of market excitement. Additionally, maintain watchlists of potential breakouts rather than chasing current moves.
Entry discipline checklist:
- ✅ Pattern meets quality standards completely
- ✅ Volume confirms institutional participation
- ✅ Fundamental catalyst supports higher prices
- ✅ Risk-reward ratio exceeds 3:1 minimum
- ✅ Position size calculated based on volatility
Patience for Optimal Setups Wait for ideal risk-reward opportunities rather than forcing mediocre trades. Furthermore, the best breakouts often require weeks of preparation and patience. Additionally, missing one breakout preserves capital for the next opportunity.
Patience building techniques:
- 🧠 Focus on process rather than individual trade outcomes
- 🧠 Maintain multiple watchlist candidates simultaneously
- 🧠 Study historical breakout patterns for confidence
- 🧠 Track success rates of different setup types
- 🧠 Remember that preservation beats speculation
Managing Winners and Losers
Profit-Taking Strategies Successful breakout trades often exceed initial expectations creating profit-taking dilemmas. However, premature profit-taking limits overall returns while holding too long risks giving back gains. Therefore, systematic scaling approaches optimize results.
Profit management techniques:
- 💰 Take 1/3 position at 20-25% gain level
- 💰 Trail stops higher as momentum continues
- 💰 Take additional 1/3 at 50% gain level
- 💰 Let final 1/3 run with wide trailing stop
- 💰 Exit completely on first sign of distribution
Loss Acceptance Discipline Accept breakout failures quickly to preserve capital for future opportunities. Furthermore, hoping and holding losing breakouts often leads to devastating losses. Additionally, cutting losses quickly improves overall win rate.
Loss management principles:
- 🛑 Honor stop losses without exception
- 🛑 Accept that 50-60% of breakouts fail initially
- 🛑 View losses as cost of doing business
- 🛑 Never average down on failed breakouts
- 🛑 Learn from each failure to improve future trades
Post-Breakout Management 🚀
Managing positions after successful breakouts determines overall profitability more than entry timing. Moreover, many traders struggle with holding winners long enough to capture significant moves. Additionally, post-breakout volatility creates emotional decision-making challenges.
Trend Following Techniques
Moving Average Support Use moving averages as dynamic support levels for trailing stops. Furthermore, different time frames provide varying degrees of trade management. Additionally, moving average breaks often signal trend changes.
MA support guidelines:
- 📈 10-day MA for short-term momentum trades
- 📈 20-day MA for swing trading approaches
- 📈 50-day MA for longer-term trend following
- 📈 Multiple MA system for staged profit-taking
- 📈 Volume confirmation when MA support breaks
Relative Strength Monitoring Continue monitoring relative strength versus market indices after breakout. Strong stocks typically maintain leadership during corrections. Moreover, relative strength deterioration often precedes absolute price weakness.
RS monitoring techniques:
- 📊 Compare stock to sector and market performance
- 📊 Watch for negative divergences developing
- 📊 Monitor RS ranking changes over time
- 📊 Exit when stock becomes market laggard
- 📊 Use sector rotation for timing decisions
Volume Analysis Continuation Study ongoing volume patterns to assess breakout sustainability. Furthermore, volume expansion on advances with contraction on declines indicates healthy trends. Additionally, distribution patterns provide early warning signals.
Volume continuation signals:
- 🔊 Above-average volume on price advances
- 🔊 Below-average volume on pullbacks
- 🔊 No climactic volume exhaustion patterns
- 🔊 Institutional participation continuing
- 🔊 Options activity remaining constructive
Common Breakout Trading Mistakes 🚨
Understanding typical errors helps avoid costly mistakes when trading breakouts. Furthermore, these mistakes often result from emotional decision-making rather than systematic execution. Additionally, recognizing patterns improves future performance.
Entry Timing Errors
Chasing Extended Breakouts Many traders buy stocks well above breakout levels after momentum accelerates. However, risk-reward ratios deteriorate significantly as distance from breakout increases. Moreover, late entries often coincide with short-term exhaustion.
Avoiding chase entries:
- ❌ Never buy >10% above proper breakout level
- ❌ Wait for pullback if missed initial breakout
- ❌ Focus on next setup rather than chasing current
- ❌ Remember FOMO leads to poor decisions
- ❌ Quality setups occur regularly with patience
Premature Base Entries Some traders enter positions during base formation rather than waiting for confirmation. Furthermore, premature entries often result in extended sideways action. Additionally, opportunity cost from stagnant positions compounds over time.
Base entry timing guidelines:
- ⏰ Wait for volume expansion before entering
- ⏰ Require price action near resistance levels
- ⏰ Confirm relative strength improvement
- ⏰ Look for fundamental catalyst development
- ⏰ Patience prevents premature capital commitment
Risk Management Failures
Inadequate Stop Loss Planning Many breakout traders enter positions without predetermined exit strategies. Furthermore, emotional decision-making during adverse moves destroys accounts. Additionally, hoping failed breakouts recover rarely works.
Stop loss requirements:
- 🛑 Determine stops before entering positions
- 🛑 Use technical levels rather than percentages
- 🛑 Honor stops without emotional override
- 🛑 Accept that losses are part of process
- 🛑 Never remove stops hoping for recovery
Position Sizing Errors Breakout excitement often leads to oversized positions relative to account size. However, increased volatility around breakouts requires smaller than normal sizing. Moreover, multiple correlated positions amplify risk dangerously.
Advanced Breakout Strategies 🎯
Experienced traders can employ sophisticated techniques to enhance breakout trading results. Moreover, advanced strategies often involve options or multiple time frame analysis. Additionally, these approaches require substantial experience and disciplined execution.
Options Strategies for Breakouts
Long Call Options Call options provide leveraged exposure to breakout moves with limited downside risk. Furthermore, options allow larger position size with less capital commitment. Additionally, time decay requires accurate timing and quick decision-making.
Breakout call option guidelines:
- 📊 Buy options with 60-90 days until expiration
- 📊 Choose strikes near current stock price
- 📊 Target 50-100% profits quickly on success
- 📊 Exit by 30 days to expiration regardless
- 📊 Never hold options through earnings unless intended
Call Spread Strategies Bull call spreads reduce cost while limiting maximum profit potential. Furthermore, spreads work well for moderate breakout expectations. Additionally, defined risk makes position sizing calculations easier.
Spread strategy considerations:
- 💰 Lower cost enables larger effective position size
- 💰 Limited upside requires accurate magnitude prediction
- 💰 Time decay affects both legs differently
- 💰 Early assignment risk on short calls
- 💰 Liquidity important for spread execution
Multi-Timeframe Analysis
Weekly Chart Context Study weekly charts to understand longer-term context for daily breakouts. Furthermore, weekly patterns often provide better risk-reward opportunities. Additionally, weekly breakouts typically produce larger moves.
Weekly analysis benefits:
- 📈 Longer-term perspective reduces noise
- 📈 Weekly bases often more reliable
- 📈 Larger profit potential from weekly patterns
- 📈 Better risk management with wider stops
- 📈 Less frequent trading reduces transaction costs
Intraday Timing Precision Use intraday charts to optimize entry timing within daily breakout setups. Furthermore, precise timing can improve risk-reward ratios significantly. Additionally, intraday analysis helps avoid false breakout traps.
Intraday timing techniques:
- ⚡ Monitor pre-market and opening action
- ⚡ Wait for initial volatility to settle
- ⚡ Look for continuation patterns intraday
- ⚡ Use volume to confirm intraday moves
- ⚡ Avoid end-of-day reversals initially
Conclusion
Breakout trading offers exceptional profit potential for disciplined traders who master proper execution techniques. Systematic approaches that combine technical pattern recognition with fundamental analysis generate superior returns. Moreover, rigorous risk management prevents the devastating losses that destroy trading careers.
Success requires patience to wait for optimal setups rather than forcing mediocre trades. Furthermore, emotional discipline determines outcomes more than analytical skills during critical decision moments. Additionally, accepting that most breakouts fail initially helps maintain proper position sizing.
Remember that the highest quality breakouts often appear risky initially but continue much further than expected. Therefore, focus on process improvement rather than individual trade outcomes. Finally, consistent application of proven methods creates long-term trading success.

Hold a Master Degree in Electrical engineering from Texas A&M University.
African born – French Raised and US matured who speak 5 languages.
Active Stock Options Trader and Coach since 2014.
Most Swing Trade weekly Options and Specialize in 10-Baggers !
YouTube Channel: https://www.youtube.com/c/SuccessfulTradings
Other Website: https://237answersblog.com/