Are you overwhelmed by the constant bombardment of hundreds if not thousands of stock recommendations by financial institutions, subscriptions and gurus?
With Stock Rover’s Screeners, you do not have to wade through all of that and we are going to discuss its uses in this Stock Rover Screener review.
The tool is designed to be your sole source of financial information and geared towards individual investors like you and me in mind.
It aims to simplify and improve how you do your financial research, decisions and track your portfolios.
Determine if Stock Rover is for you in this article about Stock Rover Screener!
Table of Contents
Stock Rover Screener: What is Stock Rover
Stock Rover is a fundamental and technical analysis tool aiming to help you research the stocks you care for without having to scramble to multiple sources and tools.
It resolves the gap in the stock research marketplace by offering tools accessible to individual investors while providing the same service that was only available to financial professionals before.
The company was founded in 2008 by two software engineers and headquartered in Braintree, Massachusetts.
The tool is packed with countless capabilities ranging from fundamental data, advanced charting, stock ratings, market news, analyze portfolios, screen for stocks and ETF’s and much more.
Their mission is “to empower investors of all levels to make better investment decisions by offering a comprehensive, accessible and affordable stock research platform.”
Traders and investors from novice to professionals who require advanced technical tools will be pleased knowing it can handle anything you throw at it.
You can control the platform by the gray menu on the left, and it interconnects the features.
The company also devised it for easy switching between displays and types of information without losing your work.
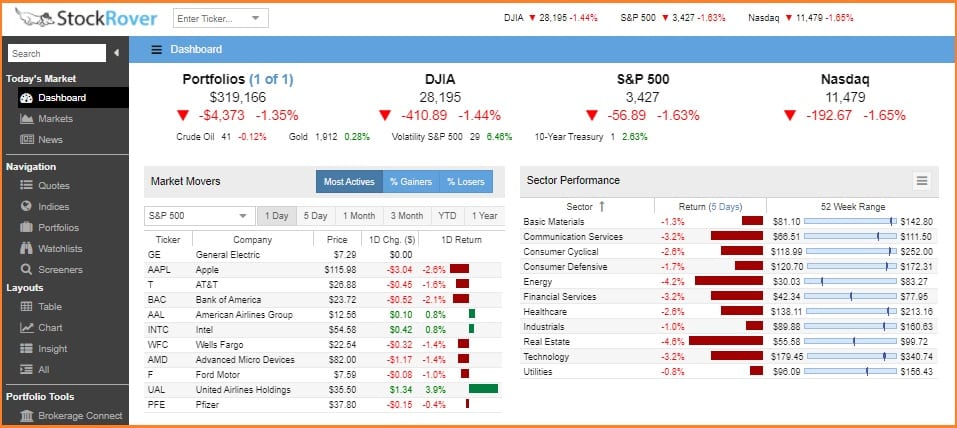
When you log in to Stock Rover, an uncluttered Dashboard that displays your portfolio, market indexes, market movers and sector performance will greet you.
It presents you with a sample portfolio made up of FANG symbols which is compared to DJIA, S&P 500, Nasdaq market indexes.
From the get-go, the tool was easy to use, but there is more than meets the eye as you can see on the navigation.
Stock Rover Screener: Who Are The People Behind Stock Rover
Stock Rover was invented because two software engineers were frustrated because they had to look up multiple sources and tools in order to perform stock analysis for their personal investments.
They decided to design and build their own integrated and comprehensive investment research platform to create a product that they would look forward to using, and make them better investors.
These software engineers are Howard Reisman, Stock Rover CEO and Andrew Martin, the CTO of Stock Rover.
Reisman is a graduate of Brown university with a degree in both mathematics and in economics.
He is also a founder of Heroix and designed and developed four system management software, namely Quantum, RoboMon, Heroix eQ, and Longitude.

Andrew Martin is the Chief Technical Officer of Stock Rover and graduated cum laude from Dartmouth College with a degree in computer science.
Martin has developed web analytics for IBM, Bank of America, and WellPoint and has worked with Reisman since 2003.
He is an expert in software design and development with a focus on user interfaces and database.

Their vision was to share Stock Rover with the trading and investment community so that other individual investors would have access to the same resources as financial professionals.
Stock Rover Features
These are the features of Stock Rover:
Today’s Market
This is the first thing you will see when you log in to Stock Rover. This is useful if you want a quick look of your portfolio or compare it against indexes.
Dashboard
Under Dashboard, your portfolio performance against market indexes such as DJIA, S&P 500 and Nasdaq.
It also contains Market Movers based on the different indexes, which you can then filter by Most Active, % Gainers and % Losers.
On the right, there is a Sector Performance, so you can keep track of the returns of each sector in correlation to time range.
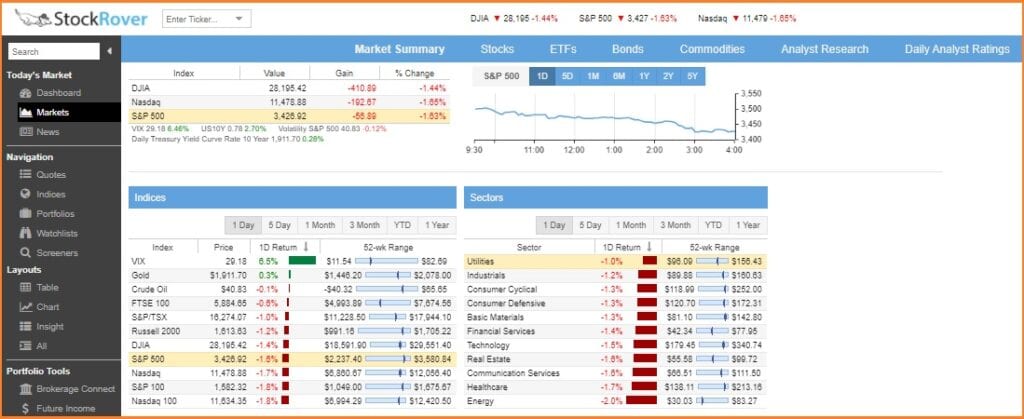
Market
Inside Market Summary, this section depicts the market returns per index relative to time range and additional tabs for stocks, ETF’s, bonds, commodities, analyst research and daily analyst ratings.
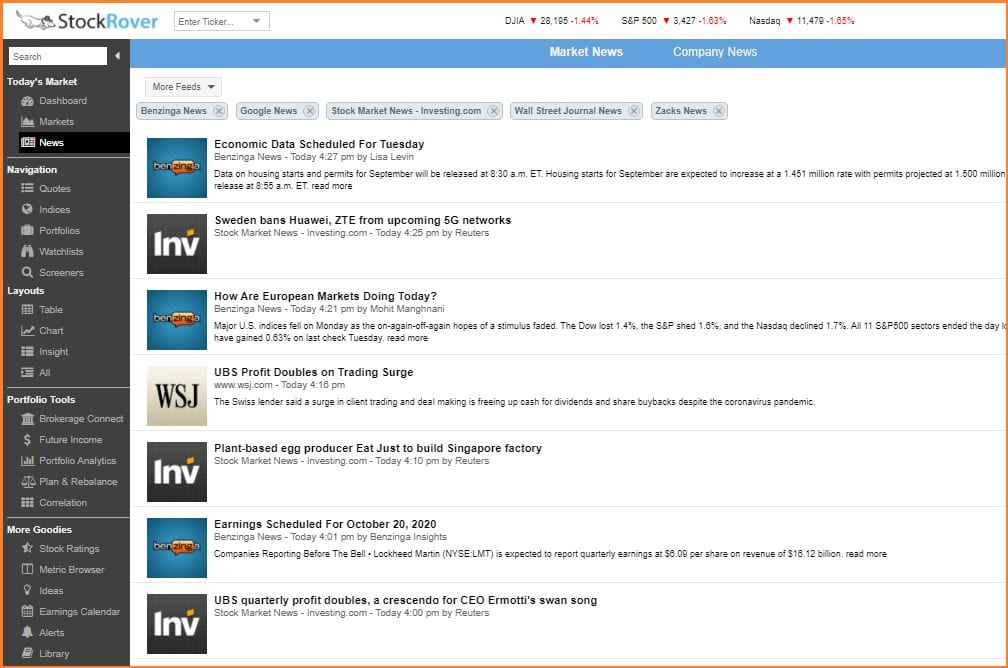
News
Stock Rover gets their news from various sources such as Benzinga News, Google News, Investopedia, Wall Street Journal News and Zacks.
If you rely on the freshest news that might affect the market, note that Stock Rover’s news is not real time.
Navigation
This is where you select what type of data set you would like to view such as a portfolio or screener.
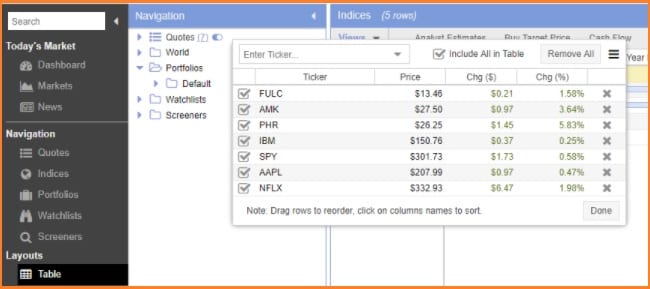
Quotes
Quotes are at the top of the Navigation panel. This allows you to quickly reference the price and daily gain or loss of a ticker, and to add tickers individually to the Table.
These tickers can then be compared to each other in the Table or viewed alongside any other dataset you have loaded in the Table.
The quotes window is also available at the top of the table next to the Actions pull down. This is helpful when the Navigation panel is collapsed.
Indices
This feature lists the following indices such as Dow Jones, Nasdaq 100, S&P 100, and S&P 500.
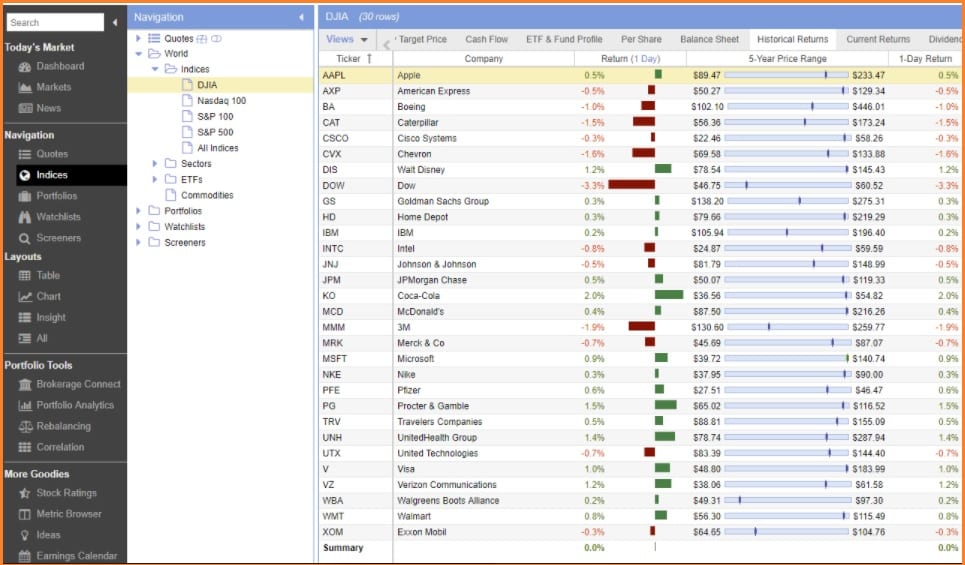
All Indices includes additional indices, which you can see in the list and screenshot below:
| Consumer Price Index |
| Dollar to CAD Exchange Rate |
| Dollar to Euro Exchange Rate |
| CAC 40 |
| Federal Funds Rate |
| FTSE 100 |
| DAX 30 |
| Gross Domestic Product |
| S&P/TSX |
| Housing Starts |
| Hang Seng |
| Industrial Production Index |
| Nasdaq |
| Nikkei 225 |
| Russell 2000 |
| SSE Composite |
| Trade Weighted Exchange Rate |
| Unemployment Rate |
| Volatility S&P 500 |
Portfolios
There are five ways you can create a portfolio from scratch. Each method is outlined below.
You can also create a portfolio by importing a CSV file or by connecting your brokerage house.
The five ways to create a portfolio are as follows:
1. With the Portfolio Manager
2. By trading a stock in the Table
3. By saving the Table as a Portfolio
4. By saving tagged tickers as a Portfolio
5. In the Dashboard
Watchlists
Watch lists are lists of stocks you want to keep track of and allow you to quickly view the data for your saved set of stocks.
They are like portfolios, but simpler, as they do not contain quantities, cash, or buy prices.
Stock Rover allows you to create multiple watch lists so you can group stocks by type, such as value, dividend or momentum stocks.
As with a portfolio, you can chart a watch list to compare against stocks, indices, industries, portfolios, or other watch lists.
Screeners
Screeners allow you to filter through all of the stocks in Stock Rover’s investment universe in order to find the ones that meet your specific investment criteria.
The available filtering criteria are comprehensive.
Stock Rover contains well over 500 screenable metrics, from price performance, financial and operational metrics, as well as sector and industry metrics.
The 14 default screeners that are in the free version are:
Buffettology Inspired
This screener is based on criteria described in the bestselling Buffettology book.
The company should have:
- 10-year track record of generally increasing EPS with no negative earnings years
- Long-term debt, not more than 5 times annual earnings
- Average ROE over the past ten years at least 15%
- Average ROIC over the last 10 years at least 12%
- Earnings yield should be higher than the long term Treasury yield.
Capital Efficiency
A screener composed of Stock Rover capital efficiency metrics.
Dividend Growth
A screener composed of Stock Rover dividend growth metrics.
Fair Value
Screen to find the 50 stocks that have the greatest margin of safety based on their computed fair value relative to their price.
Growth at a Reasonable Price
A screener composed of Stock Rover GARP (growth at a reasonable price) metrics.
Large Cap Growth with Momentum
This finds large companies (greater than 5 billion in market cap) that are exhibiting strong revenue and earnings growth and are still reasonably priced.
Also, a company’s stock price must be performing reasonably well vs. its industry and the S&P 500.
Large Cap Value
This finds large companies (greater than 5 billion in market cap) that are inexpensive by traditional measures such as low price to earnings, price to sales and price to book.
These companies should still be growing sales and earnings.
Long Term Growth
A screener for a continuation of the current market trends. Solid economy, reasonable growth, and low interest rates that may rise slightly in the future.
Companies that pass should be mid cap or larger, growing, getting more efficient and not be reliant on debt for financing.
This screener requires the import of the custom metric Net Cash as a % of market cap.
Piotroski High F-Score
This screener uses 9 criteria that look for companies that have solid financials that are getting better.
The original 9-point system was developed by Joseph Piotroski, a professor of accounting. Passing companies must have a score of 9.
Relative Strength
Find stocks with strong relative strength defined as consistent out-performance vs. the S&P 500.
Safe Performers
Stocks with high institutional ownership, low Beta, respectable financial health, value and quality grades and long-term outperformance vs. the S&P 500.
Small Cap Growth
This screener was built with criteria used in the BetterInvesting methodology to find promising small-cap growth stocks.
Strong Buys
Finds stocks with a high margin of safety that are also in favor with the market as shown by a sentiment score in the top quartile and a recent buy sign from the MACD technical indicator.
Top Stocks
Top Screen is determined by backtesting multiple strategies.
Layouts
This feature controls how and what kind of information about your data set displays in the main window.
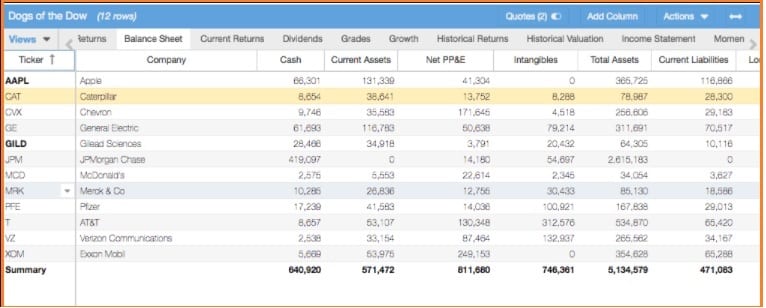
Table
The Table provides a flexible spreadsheet for viewing tickers and their data.
Below is a screenshot example of the main Table in the ‘Balance Sheet’ view.
The Table header shows the dataset (“Dogs of Dow” watchlist) and the number of total rows (12).
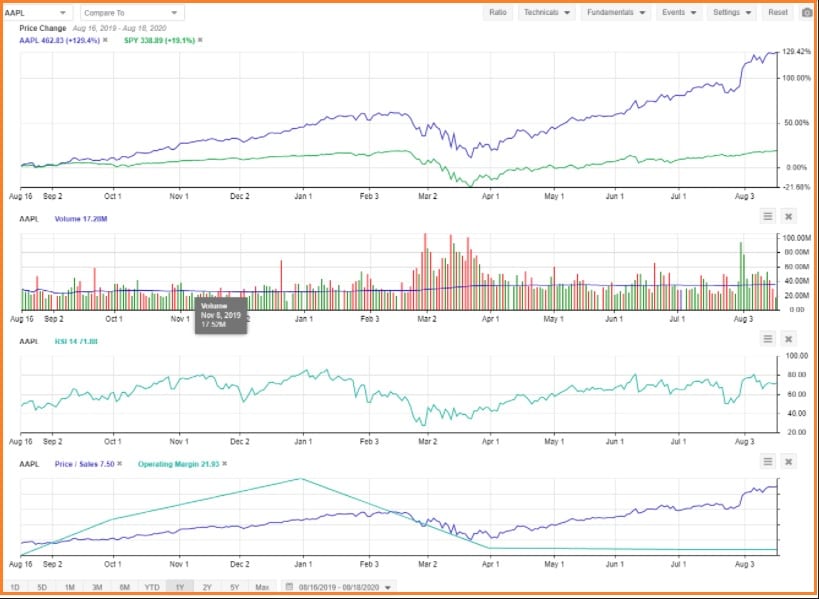
Chart
Stock Rover has an extensive charting capabilities.
For example, you can chart price, chart over 100 fundamentals and chart key technical indicators or with baseline stocks to for easy relative performance comparison.
Charts can be displayed by price, percentage, logarithmic or candlesticks and can include or exclude dividends.
Events can be added to charts, such as buy/sells, dividends, splits, earnings events and max drawdowns.
Insight
The Insight Panel contains tools for researching stocks in depth. It also provides a section where context aware links can be made to external research sites.
This contains five tabs namely:
- Summary – Includes an array of basic information about the company, including Scores, as well as data for Estimates, Growth, Profitability, and Financial Health, and other relevant data.
- Visuals – Visuals are a fully user-customizable display. Out-of-the-box Stock Rover ships with seven different tabs or sections under the Visuals tab of the Insight Panel.
- News – Shows pertinent news for the selected ticker. The organizations providing the news feeds can be specified as well.
- Analysts – Shows analyst data covering both ratings and estimates in a number of different categories.
- Statements – This tab contains data for a selected stock like income statements, balance sheets, and cash flow statements.
Portfolio Tools
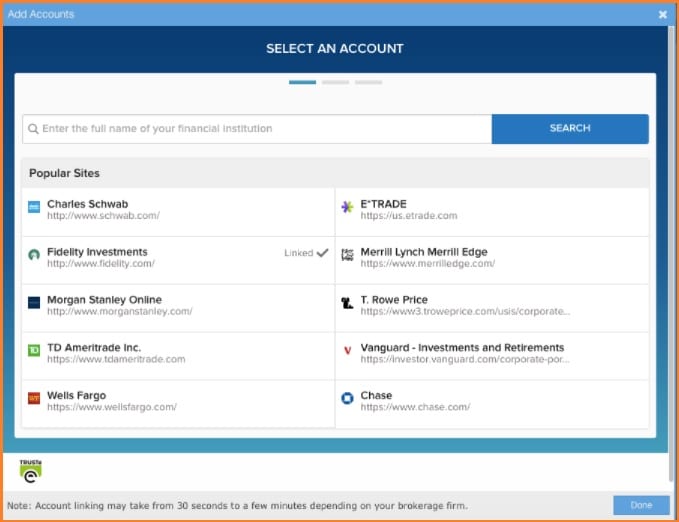
Brokerage Connect
Stock Rover can connect to your brokerage firm/s via Yodlee.
Stock Rover will keep the positions in your Stock Rover portfolios in sync with your brokerage accounts.
Connecting your Stock Rover account to your brokerage house(s) is the easiest way to keep your portfolios up to date.
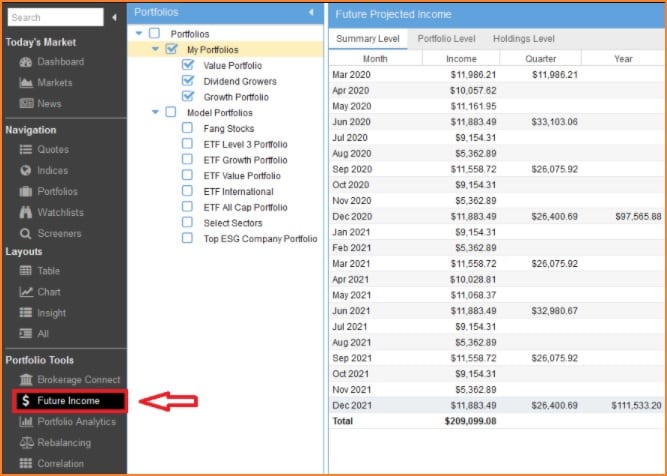
Future Income
The Future Income Tool projects your future dividend income on a monthly basis for the portfolios you select.
The monthly income in turn is computed from the individual stocks, ETFs and mutual funds you own.
The computation is based on recent dividend payment history. The projection assumes no increase or decrease to the current dividend rate a company, ETF or fund pays.
Portfolio Analytics
The Stock Rover Portfolio Analytics facility allows you to analyze the overall performance of your portfolio and performing the individuals holdings that make up your portfolio.
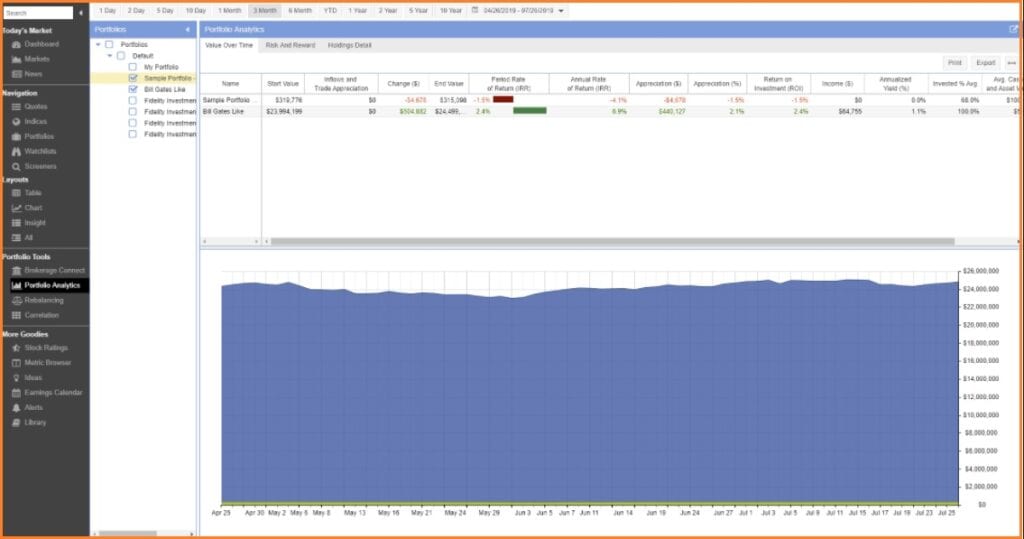
There are three basic sections to the Portfolio Analytics Facility.
Value over Time – shows you how your portfolio’s value has changed over time, factoring in both inflows, outflows, and the underlying change in the value of the investments themselves.
Risk and Reward – shows the amount of risk you took to achieve your return.
It includes such metrics as return vs. the S&P 500, maximum drawdown, volatility, risk-adjusted return vs. the S&P 500, and the Sharpe ratio.
Holding Detail – shows the contribution of the different holdings of the portfolio to overall portfolio return.
It will include any holdings you held during the period of reporting, not just the current holdings.
With this section, it is easy to see which positions are punching above their weight and which positions have been creating the most drag on portfolio performance.
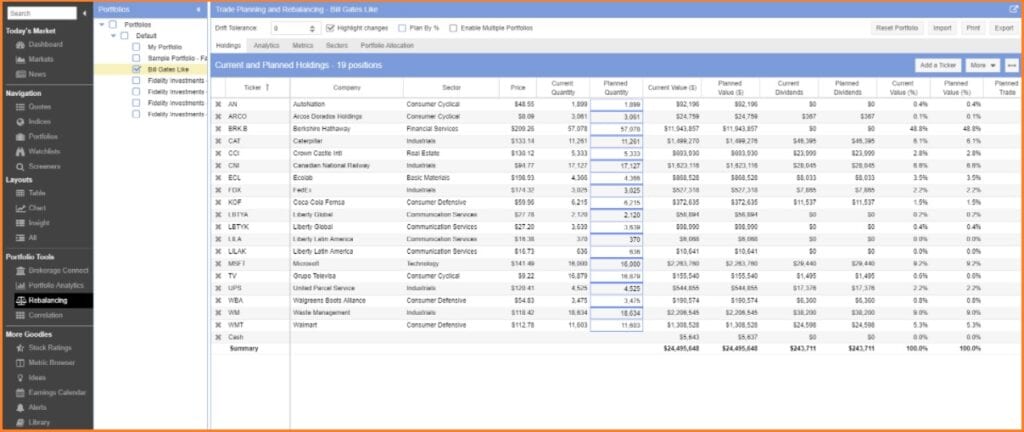
Rebalancing
Portfolio rebalancing allows you to set desired allocations for stocks in your portfolio by percentage.
You can also set a drift tolerance, which is how much you are willing to allow your portfolio stray from your desired allocations.
Stock Rover will then show you what is out of balance and by how much, and the trades, you need to make to get back in balance.
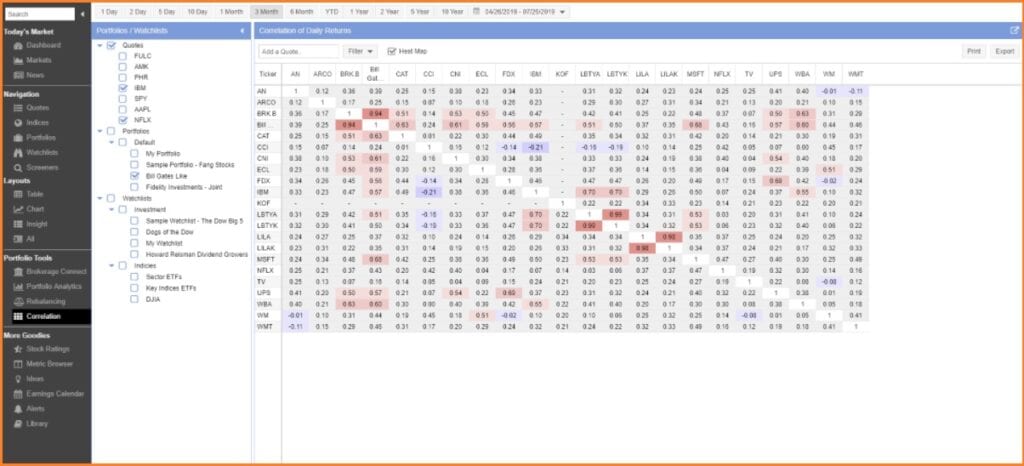
Correlation
This feature shows correlation between all the individual holdings of the portfolios or watch lists selected on the left.
Besides portfolios and watch lists, you can add additional tickers for correlation analysis via the add quote box.
Correlation is a statistical relationship between asset prices. It is represented by a coefficient that measures, on a scale of -1 to 1, how likely it is that the price of two assets will move together—that is, how likely it is that they’ll both go up or that they’ll both go down. If two assets have a correlation value of 1, this means that they have a perfect positive correlation—they move in the same direction and in the same proportion 100% of the time. A perfect negative correlation has a value of -1, and it would mean that the assets move in opposite directions in the same proportion 100% of the time. A correlation value of 0 means that the assets move together 50% of the time. They are equally likely to move together as they are to move in opposite directions.
Stock Rover’s correlation computation use the daily dividend adjusted price change percentage of an equity, ETF, mutual fund, portfolio or watch list.
More Goodies
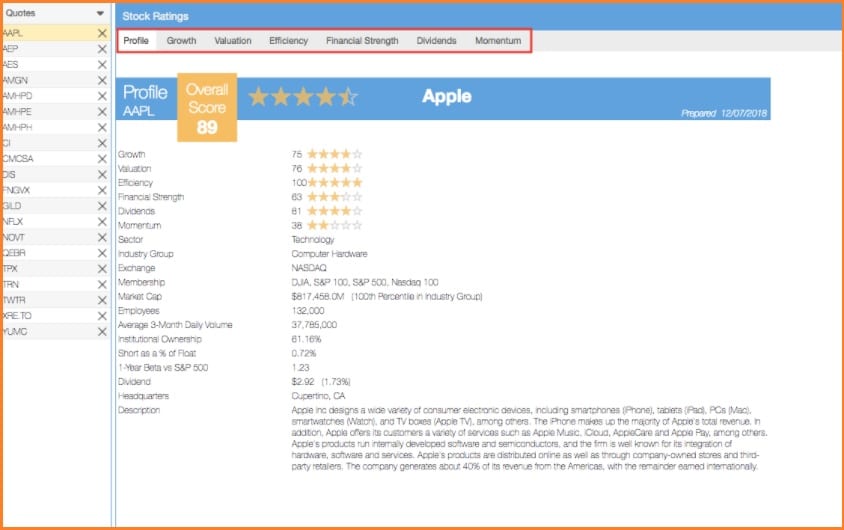
Stock Ratings
This feature provides investors with a simple overall percentile rank of a company within an industry group.
It bases the rank on the weighted summation of the component percentile ranks of the company in several areas.
Such as operational performance, balance sheet strength, efficiency, valuation and momentum.
Both the actual performance and the volatility of the performance are considered when computing a company’s rank.
It grades the stocks based on the following factors:
- Revenue Growth
- Operating Income Growth
- Net Income Growth
- EPS Growth
- Revenue Per Employee
- Next Year’s Expected Revenue Growth
- Next Year’s Expected EPS Growth
- Morningstar Grades – Growth
- Intangible Assets as a % of equity growth
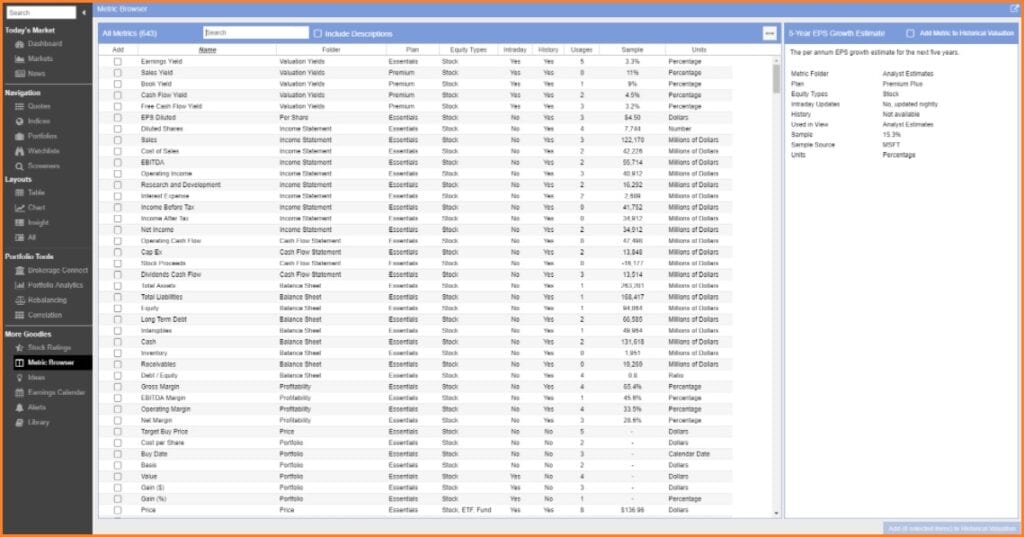
Metric Browser
This tool gives you a simple way to see all of the metrics available in Stock Rover.
There is a built in search capability to make it easy to find the metric(s) you are looking for.
It supports partial matching. So, for example, you could put “price” in as a search term and it would display all metrics with the word price in the metric name.
You can change the search to also include metrics descriptions as part of the search.
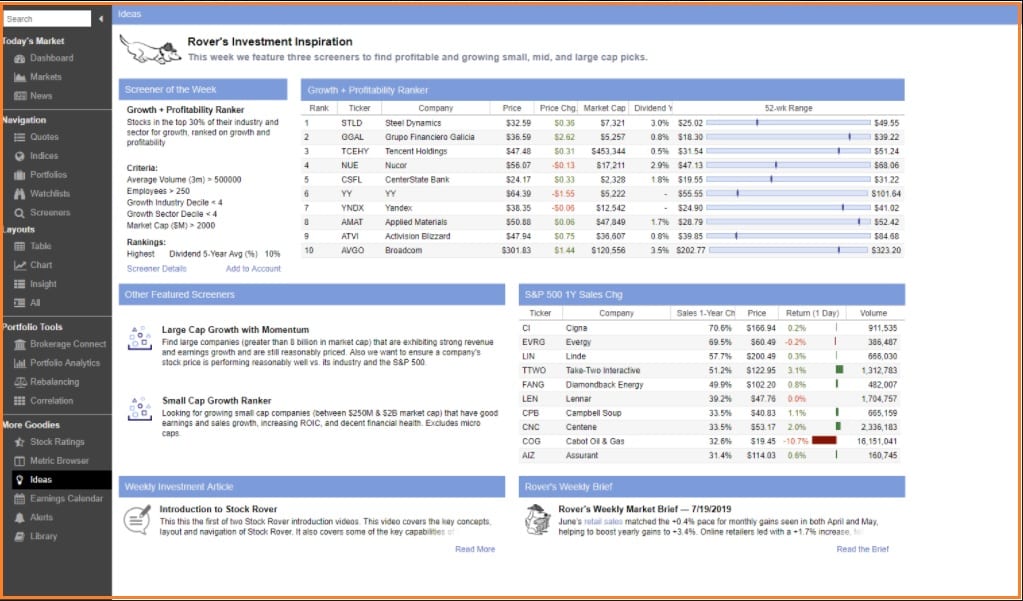
Ideas
The ideas panel comprises some tips and tools that Screen Rover thinks will be helpful for you.
It highlights a screener every week and we feature helpful screeners.
As you can see in the screenshot below it contains some helpful tables and links to our weekly investment article.
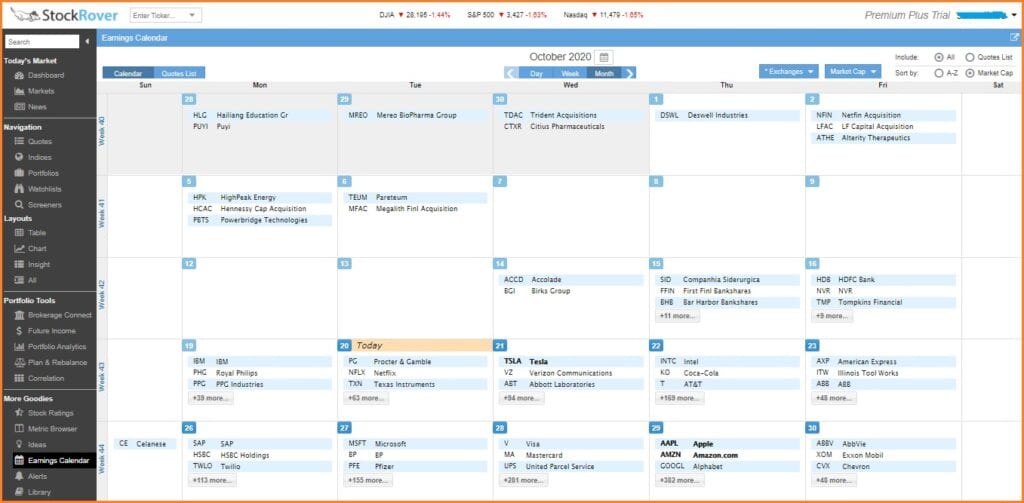
Earnings Calendar
The Earnings Calendar allows you to see when companies will report their earnings and is comprehensive and flexible.
You can view all the companies in Stock Rover’s investment universe, which are the major North American exchanges.
You can also see the earnings dates for only the companies you are interested in, which is defined by the stocks in your quotes list.
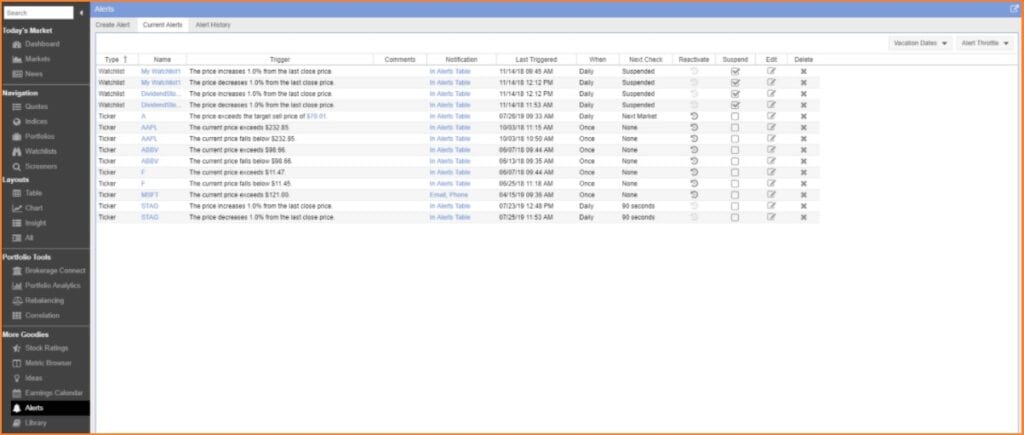
Alerts
This feature allows you to receive a text or email alert when something happens in the market of interest to you.
Examples are a stock or ETF exceeding or falling below a set price point, price increases or decreases that exceed thresholds or an earnings event.
You can even alert on things like the P/E of a stock exceeding or falling below a certain level as well as unusual levels of volume.
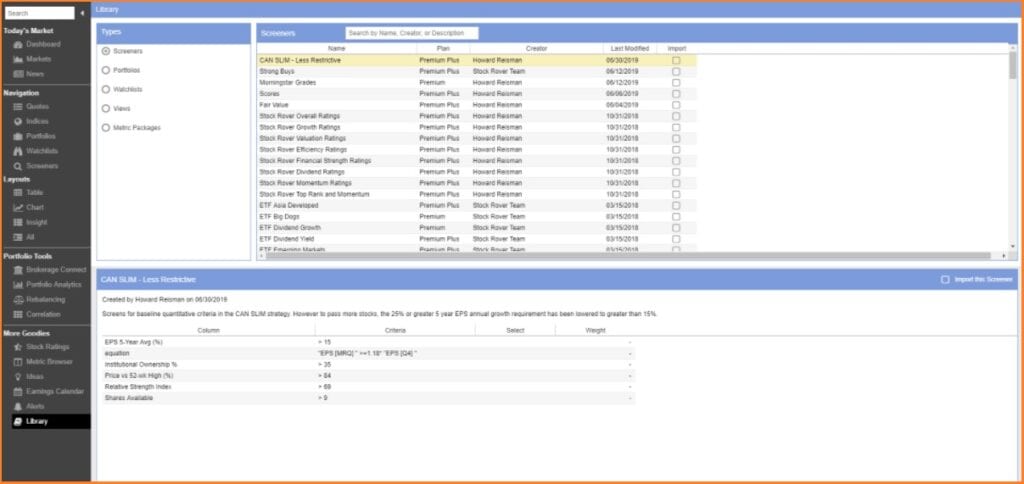
Library
This is a repository of a variety of different investment research resources that can be imported into your Stock Rover account for your own investment research use.
The library contains a variety of screeners, model portfolios, watch lists, views, and metric packages.
Any item in the Library can be imported into your Stock Rover account, and you can import several items at once.
This is useful if say you have a particular newsletter or research platform that you can link into your account for easy access.
How Can You Make Money With Stock Rover
Stock Rover is marketed as the only source of fundamental information and technical analysis you will ever need.
Thus, you can use that to your advantage and cut all the unnecessary researching to other sources, which can honestly cut into your time if you are actively trading.
So you can make timely and informed decision pertaining to trading and investing, making you a more effective and efficient investor or trader.
What Do People Say About Stock Rover
Warning… I am a fan-boy… I have been a subscriber to Stock Rover for three-plus years. In the first year, I did not put in the effort to learn the program well enough to really let it pay for itself. For the last two years, I have basically used it daily. When I watch CNBC or Bloomberg, my laptop is next to me so I can look up stocks or make notes on Stock Rover. Everyone has their own investment approaches. I am a believer in fundamentals and cash flow analysis with an emphasis on revenue growth. You might be a dividend or value or technical analysis investor. Over the last 30 years; I have used Value Line, AAII, Investools, The Motley Fool, and Investors Business Daily fee-based services. I find that Stock Rover beats them all. Stock Rover allows you to easily take the data or investment approach you like and find stocks that meet your parameters (not the same list for all subscribers). The disadvantage is that it requires some investment knowledge and a small amount of effort on your part. If you are willing to do your part, if your willing to put in some amount of time; Stock Rover is the best affordable tool available for the ordinary person. If you learn to use it well enough; I believe it can even give you an advantage over professional money managers. Most of them are sheep. If you have no knowledge of financial statements or markets; Stock Rover may not be for you. If you are unwilling to acquire the knowledge and put in the effort; your best bet might be to subscribe to and follow Cramer or any of two dozen other stock-picking services. Don’t depend on some supposed stock guru. My advice… Invest in yourself by reading investing books, learning, and subscribing to Stock Rover…
NevadaScrubJay 1 year ago
These are reviews over at Investimonial:
This program is amazing and unlike any that I’ve used, in that it’s simple to make comparisons between stocks using their hundreds of metrics, but what really sets the company apart is its customer service. I’m on the west coast and was having difficulty figuring out how to add a stock to my portfolio so I emailed one of their executives who IMMEDIATELY got back to me and suggested a web meeting to so he could show me how to do it. This was at 8:30 Pacific time. I’m used to dealing with companies like TD Ameritrade and Fidelity so I couldn’t believe the personal help that I was offered. He ended up demoing about 25 minutes of the tool’s features and answered all of my questions. Three thumbs up!
JustSueForNow November 2012
Even though it has some Technical criteria like SMA, EMA, RSI, Bollinger, it’s mainly a Fundamental screener. It has A LOT of criteria values and it auto-updates on each criterion added (like others) and it’s pretty fast.
What I really like are the sorting tabs after the Screen results. You’re able to sort via: dividends, Portfolio Performance, and Returns vs SP500, etc.
Overall very nice.Krash February 2013
Stock Rover hits all the right notes; easy to use, yet it packs a lot of fundamental analytical tools and profiling into such a clean little package. Support has been responsive to glitches (usually stuff I didn’t quite understand). Versatile, easily customizable. With some printing capability, it would rock even more!
It’s useful. Period.JayCee October 2012
It has by far more investment and portfolio management information on one page than anything I’ve come across. The data is very clear and efficient in how it’s arranged. It provides you an amazing amount of info on this one page that you can view and access. You can set up all kinds of portfolios and watch lists and then develop various views with performance data and hundreds of metrics. You don’t have to go to this page, that page, etc. Everything is in one place and you can visually see the data quickly and all together. It is continually being improved and the feedback from the developers to your questions, suggestions, etc, is very responsive and thoughtful. It is obvious they are listening and reading what you’re sending to them.
I highly recommend it to anyone reading this and have to my friends and family members interested in investing. I use Yahoo Finance, Wikinvest, Morningstar and have been a subscriber to Morningstar Premium for two or three years but not currently. StockRover is better.OldInvestor July2012
About a month ago, after reading about it in Barron’s magazine, I decided to give StockRover a try. I am impressed with the level of detail and simplicity of use. The fact that it is a web application makes it readily accessible from both a PC and a MAC. You can create your portfolios (it even lets you import directly from brokerage-exported account positions). You can easily build stock screeners. I haven’t had a chance to play with all screening criteria, but I know that it contains some metrics that do not exist in prominent brokerage firm trading platforms. There are a few other aspects I enjoyed playing around with. For instance, you can drill down into indices, industries, and individual companies and it gives you different views based on your selection (valuation, growth, returns, etc. or you can define your own views). The charts have all the standard bells and whistles you’d expect (moving averages, technicals). Best of all, it is free. Well, at least for now, as I don’t know what the company plans are for this wonderful application. Strongly recommended.
Baroque July 2012
In Quora:
I make extensive use of Stock Rover.
The software ships with many default screeners already setup. The quickest way to start is to take one of the default screeners that is closest to what you want to do, and then select “Update Screener”, modifying the criteria or filters that you want to change.
More screeners are included in the Library and can be imported to your Stock Rover account.
Stock Rover in addition to screening delivers all kinds of analytics. It’ll rate the stocks for you based on a whole host of fundamentals. Another cool capability is the “Research Reports”, again Stock Rover delivers a wealth of information.
Ken Leoni January 30
What Are Alternatives to Stock Rover
Stock Rover alternatives that we recommend are Finviz and TradingView.
The crucial difference with Stock Rover and Finviz is that, with the former even though it has a technical analysis, it is still not as robust with Finviz.
While with TradingView, it focuses still on technical analysis indicators, Stock Rover on the other focuses on charting the fundamental strength indicators.
Go check our Finviz Review and TradingView vs Finviz for options article now!
What We Like And Don’t Like About Stock Rover
The 10-year fundamental analysis per ticker is impressive as its comprehensive and the Rebalancing feature is helpful if you want to keep your portfolio diversified.
There is also an option to connect your brokerage which is nice so that Stock Rover can synchronize changes in your portfolio.
The major drawback to this tool is that it only has seven technical indicators for charting, which is quite weak compare to other services.
Stock Rover Pricing
Upon creating an account, you have a 14-day access to the Premium Plus subscription.
This is great if you want to test the waters first and make sure that Stock Rover is for you.
After the trial period, your account will revert to the Free version or you can choose between Essentials, Premium and Premium Plus plan.
The Stock Rover Essentials is $7.99/month, Premium is $17.99/month and Premium Plus is $27.99/month.
Stock Rover Refund Policy
“StockRover.com is a pay-as-you-go service. Consequently, we do not issue refunds, regardless of the reason for cancellation. A refund will not be issued even if you cancel immediately after your credit card is charged for the new billing period. For example, if we charge your credit card on June 8th, and you cancel your subscription account on June 9th, you are still responsible for paying for the entire billing period. This will be the remainder of the monthly period if you are on the monthly plan, the remainder of the yearly period if you have selected the yearly plan, or the remainder of the two-year period if you are on a two-year plan. No subsequent charges are applied to your credit card, but the amounts already charged are not refunded. We treat all customers equally and therefore do not make exceptions to this policy.”
As taken from Stock Rover website
PROS and CONS
Pros
- Has a Free version and a 14-day trial for the Premium Plus
- Has a 10-year fundamental analysis for a symbol
- You can easily toggle to compare your portfolio against the market indexes
- Asset Allocation feature and Rebalancing is great if you want to make sure that your portfolio is diversified
Cons
- Investors or traders who rely on technical indicators might not like it since it has limited charting capabilities
- Takes a bit of time to get the full benefit of the tool as it has expansive features available and you need to study how to effectively use it
- News is not real-time
Final Thoughts: Is Stock Rover A Yes Or A No?
Concerning this Stock Rover Screener review, we can say that if you value fundamental information and qualitative data, then it is a yes.
However, it does not have powerful technical indicators unlike its competitors’ so technical traders might not find value in subscribing.
The free features are also good on its own as it gives important features, but if you want all the fancy stuff, then there is a paid subscription for you.
Also, the fact that it can save you time in researching about your portfolios or stocks that you are watching is plus on our books.
Do note, that in order to get the full bang for your buck with this subscription, it takes quite some to fully understand its features and functions
Thoughts? Comment down below!
Stock Rover
$7.99 vs $17.99 vs $27.99 per monthPros
- Has a Free version and a 14-day trial for the Premium Plus
- Has a 10-year fundamental analysis for a symbol
- You can easily toggle to compare your portfolio against the market indexes
- Asset Allocation feature and Rebalancing is great if you want to make sure that your portfolio is diversified
Cons
- Investors or traders who rely on technical indicators might not like it since it has limited charting capabilities
- Takes a bit of time to get the full benefit of the tool as it has expansive features available and you need to study how to effectively use it
- News is not real-time