Feeling lost in the sea of options trading indicators ?
I know it can be very confusing for options trading beginners to choose the best trading indicator for your Options trading.
In this tutorial, I will reveal the best options trading indicator I have been using to generate big options trading profits.
By the end of your reading, I will take your through an easy step by step guide on how to use my 2022 best Options trading indicators.
Table of Contents
Options Trading Indicators | What Is An Indicator ?
If you are new to stock and options trading, chances are you in the midst of learning various options trading indicators.
Before we delve into this tutorial, let’s take some time to define what is a technical indicator in options trading.
Options derived their value from the underlying stock they are based on.
Therefore, when you refer indicator for options trading, we really imply indicator the the underlying stocks.
Options trading indicators are signals that help options traders enter and exit option trades.
This means that in order to take a trade on AAPL options, a trader will wait for his/her indicator of choice to satisfy a specific criteria.
Are All Options Trading Indicators Worth It?
Many options traders often combine several indicators in order to make a decision on a trade.
How many indicators are out there for options trading ?
I am not sure I know the full exact count.
However, I can tell you that in the large communities of TradingView, there are over 100 indicators for option trading.
Which bring the question: How does one know which one(s) to use especially when one is a beginner options trader ?
I guess the simple answer is why you are reading this very tutorial by leveraging my many years of experience with options trading indicators.
How Many Indicators Do You Really Need ?
My philosophy in options trading is to keep things simple and successful.
The Famous K.I.S.S. rule
You see what I did there ? Successful and Successful Tradings.
The smaller the number of indicators you are checking the easier it will be for you to avoid analysis parlysis.
Many of these indicators can contradict each others at times thus leaving you the option trader more confused than you should be.
We will learn in the upcoming section sections which ones I use and will give you a step-by-step guideline on how and when to rely on them.
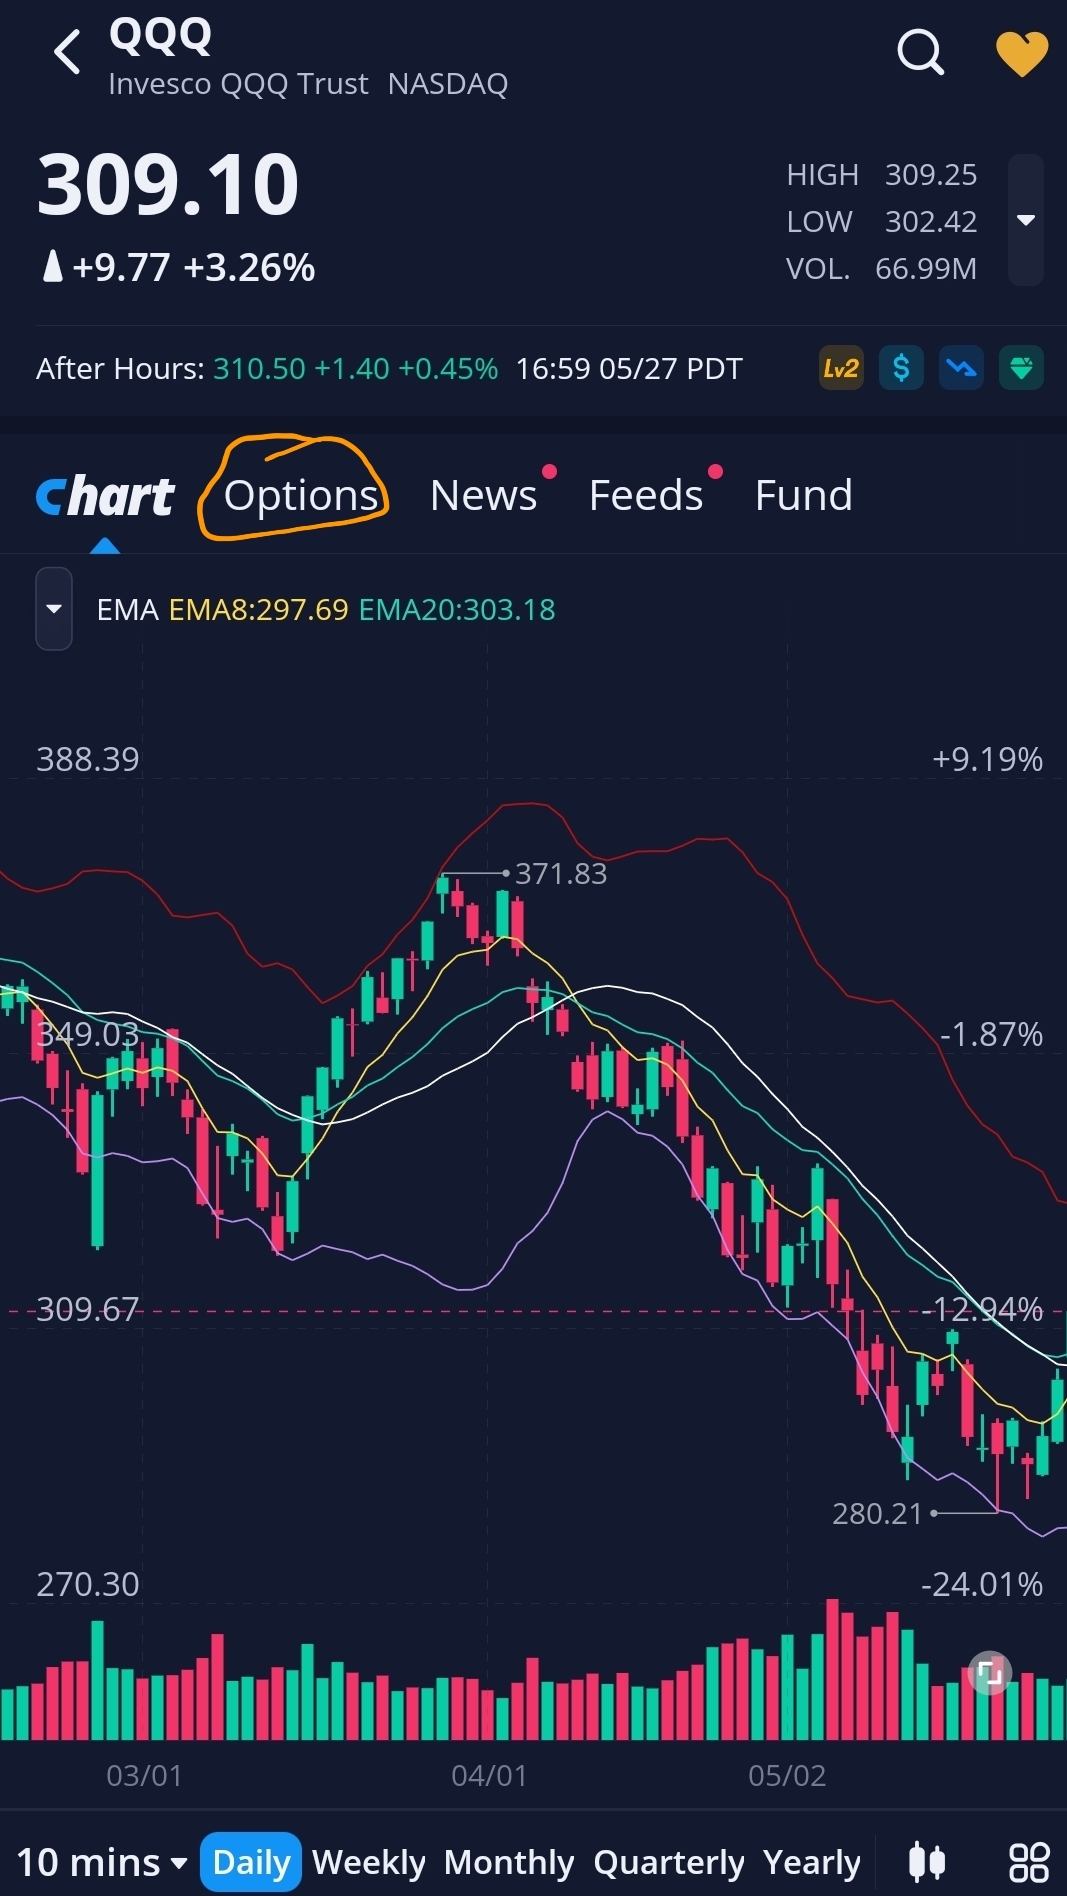
Best Indicators For Intraday Options Trading
Most indicators for options trading are valid for different timeframes.
By that I mean, you can use them at any time granularity that you decide on.
I know traders who use 1 minute chart for options trading.
I am not one of them.
I prefer the 15-minute intervals because the charts have less noise.
Granted at the beginning of trading days, I often use 5-minute charts until there are enough candles to switch tothe 15-minute view.
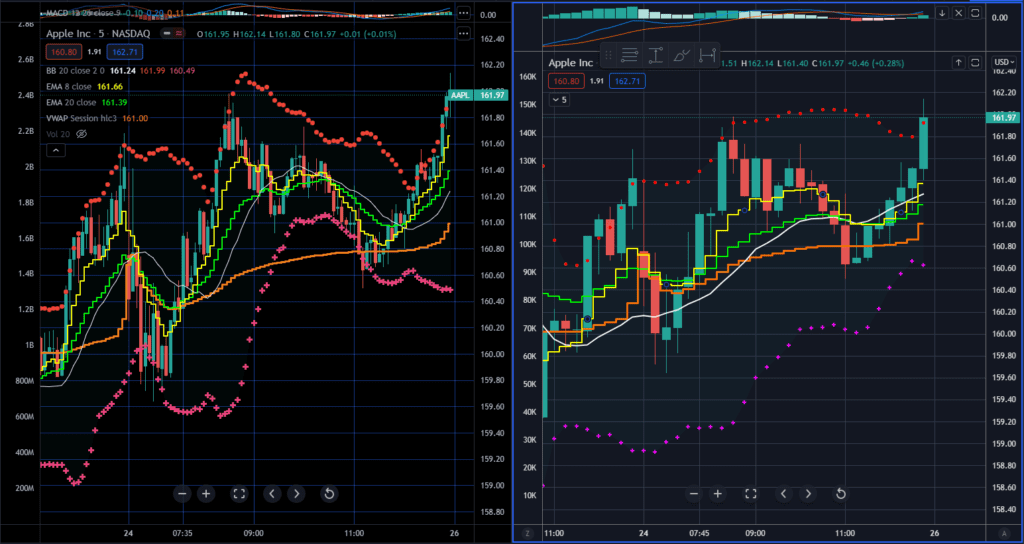
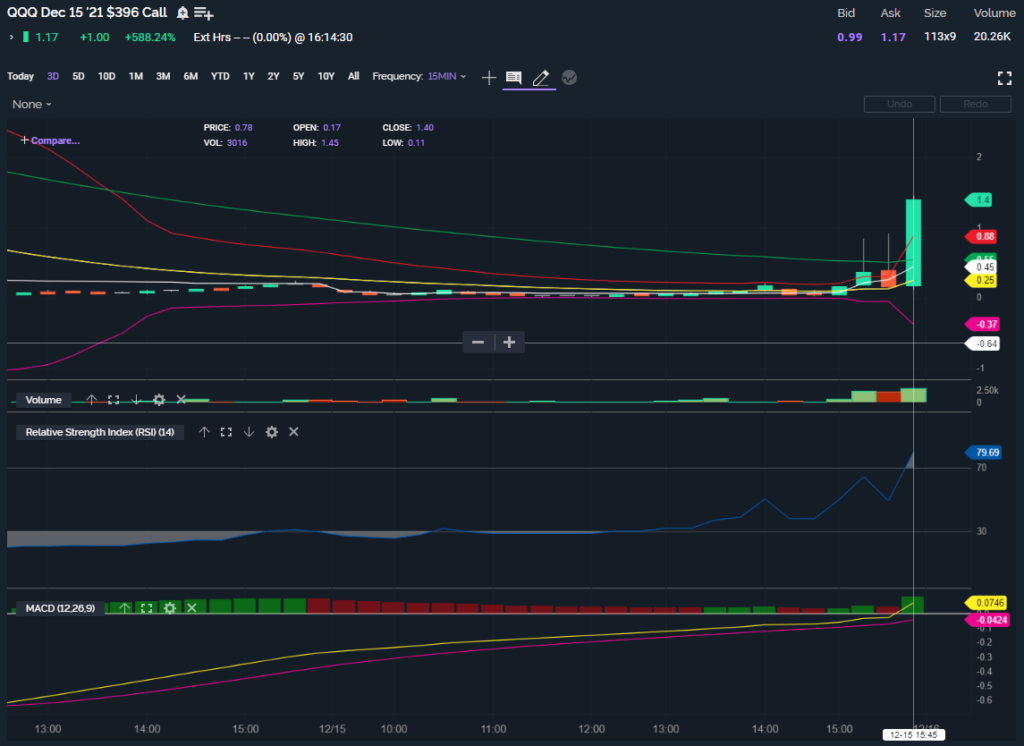
In the view above, one can see the 5- and 15-minute chart for AAPL stock.
The 15-minute chart has 26 candles for an entire day of trading vs 78 candles for the 5 minute chart to capture the entire 6.5 hours.
Bollinger Bands
The Bollinger Bands indicators are not that well known.
One way to give importance to the Bollinger Bands indicator is to consider them as natural support and resistance levels.
First, there are 2 of them.
The Upper Bollinger Band is the top one in red on the BBY stock daily chart below.
Lower Bollinger Band is the lower one in purple.
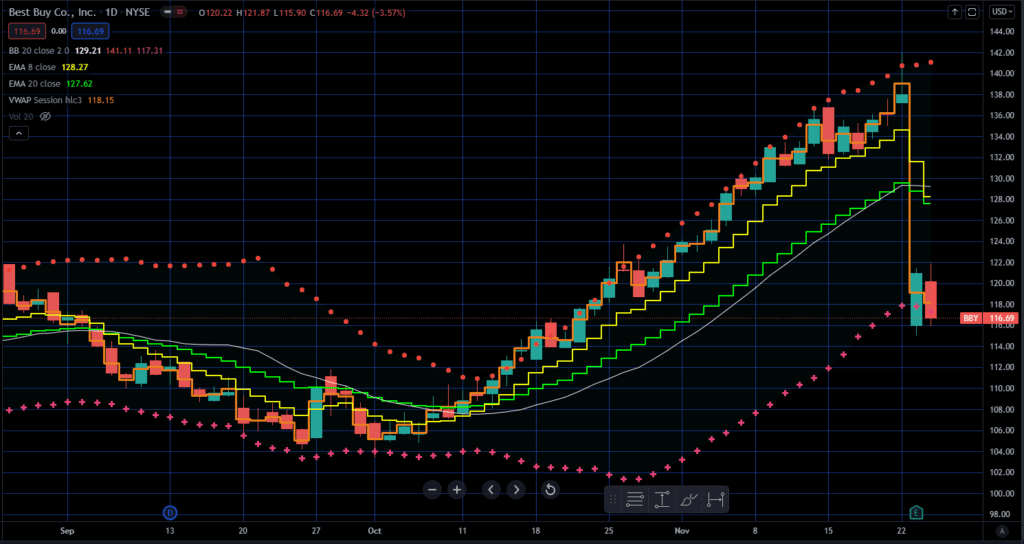
Together, they form an envelope within which the stock price oscillates most of the time.
The Lower Bollinger band serves and natural support meaning the price will tend to bounce off it.
Whereas the Upper Bollinger Band is a resistance level the price usually have a hard time going above.
I say “usually” because it is not rare for stocks with strong momentum to trade higher (outside) than the Upper Bollinger Band.
As an illustration, check out the above daily chart for BBY stock moving along between the Upper Bollinger Band (red dots) and the EMA8 Yellow line.
After Earnings on November 23, the BBY stock felt below the lower Bollinger Band (purple crosses) and was able to bounce off it on that day.
Moving Average Indicators
Moving average are by far the most popular indicators for options traders.
There are calculated by averaging the price over a given number of candles.
You would hear trader ssay MA8, MA9, MA15 or MA20.
These refer to Simple moving Average 8, 9 , 15 and 20 respectively.
The numbers are the number of candles the average is considering.
Therefore , if you happen to be looking at a daily chart (each candle represent one trading day), these moving average consolidte price price over as many days : 8 days , 9 days, 15 days and 20days.
Should you use 15-minute interval, 8 candles will account for 2 hours.
What Is The difference between Simple and Exponential Moving Averages
If you happen to attend a Coaching session with me or watch one of of my technical analysis Videos on my YouTube channel, you will hear me say EMA8 and EMA20 .
Tha tis because I use the Exponential Mobving Average 8 and 20 period.
Why Exponential in lieu of simple ?
Because the Exponential moving average gives more weight to the most recent candles.
For instance, in the MA8, all candles have the same weighting whereas the EMA8 will give 33% more weighting to the last 3 candles.
Think of tit this way: If someone want to predict your future and you are telling that what you did the last 8 months.
Chances are the actions you have taken over the last 3 months are more indicative of the potential direction you are going.
How To Use Moving Average For Options Trading Exit
Either you are using MA or EMA options trading indicator, you need to know that in a bullish trend, the moving average become a support line.
This means that if the price start falling because your EMA8 for instance, then the trend is changing and it is time too exit or at least start scaling out of that bullish trade.
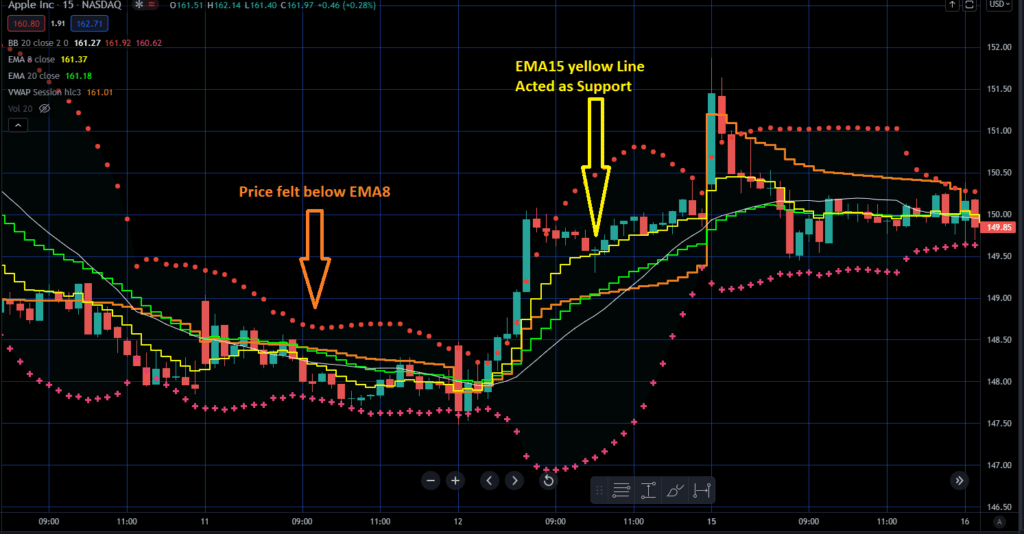
On the chart above, the first arrow point to a time when the EMA8 stopped being support for the stock before a bearish trends begins.
The second arrow(in yellow) depicts a scenario where the price bounced off of the EMa8 before continuing higher.
In such instance, options traders can confidently stay in their call options and enjoy further gains later simply by applying the concept of support from EMA.
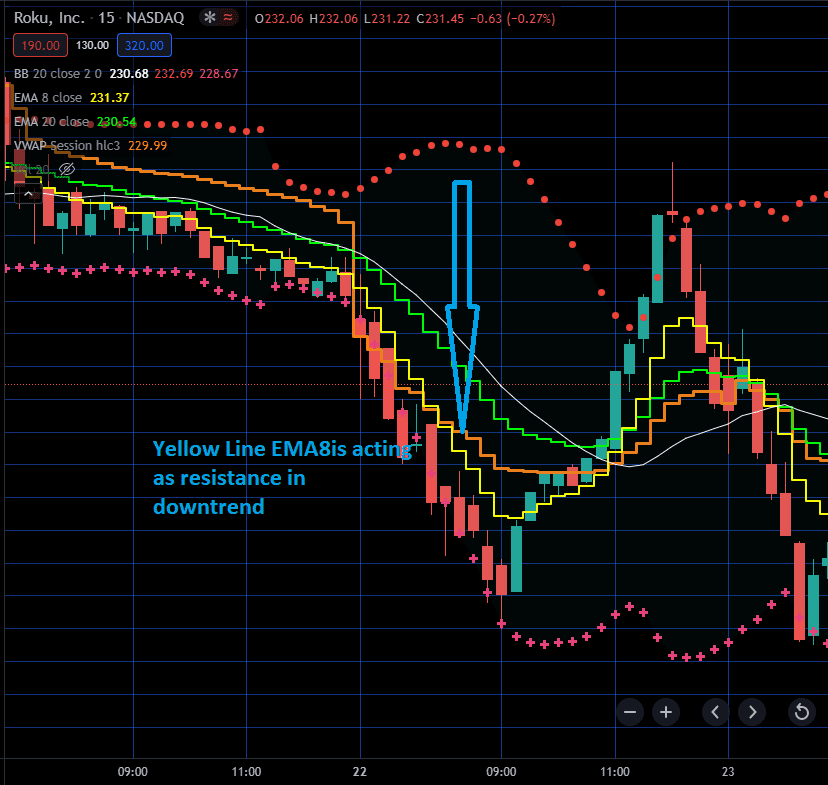
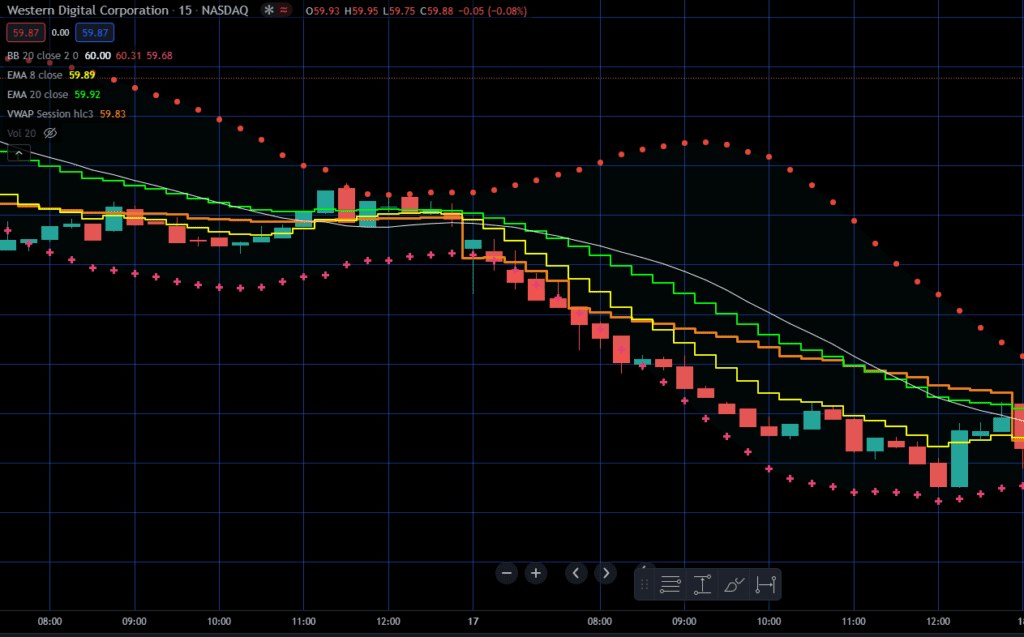
On the other hand, when the price of a stock is going down, EMA8 will act as resistance.
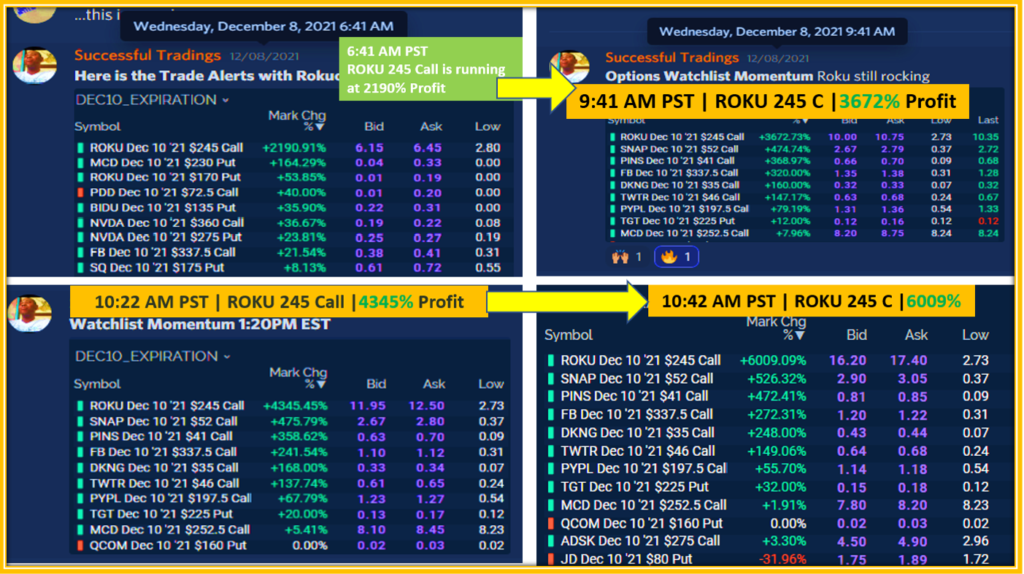
Below is a good illustration on a recent trade we traded on Roku with Puts while the stock was going down while EMA8 is behaving a great resistance.
Why I Use Two Moving Averages Indicator
I use two Moving averages because the shorter term one (EMA8) tracts the most recent momentum whereas the longer term one (EMA20 , green in my chart) depicts a slighter longer term momentum.
Consequently, the crossing of the EMA8 over or below the EMA20 is a good indicator of the strength of the recent momentum.
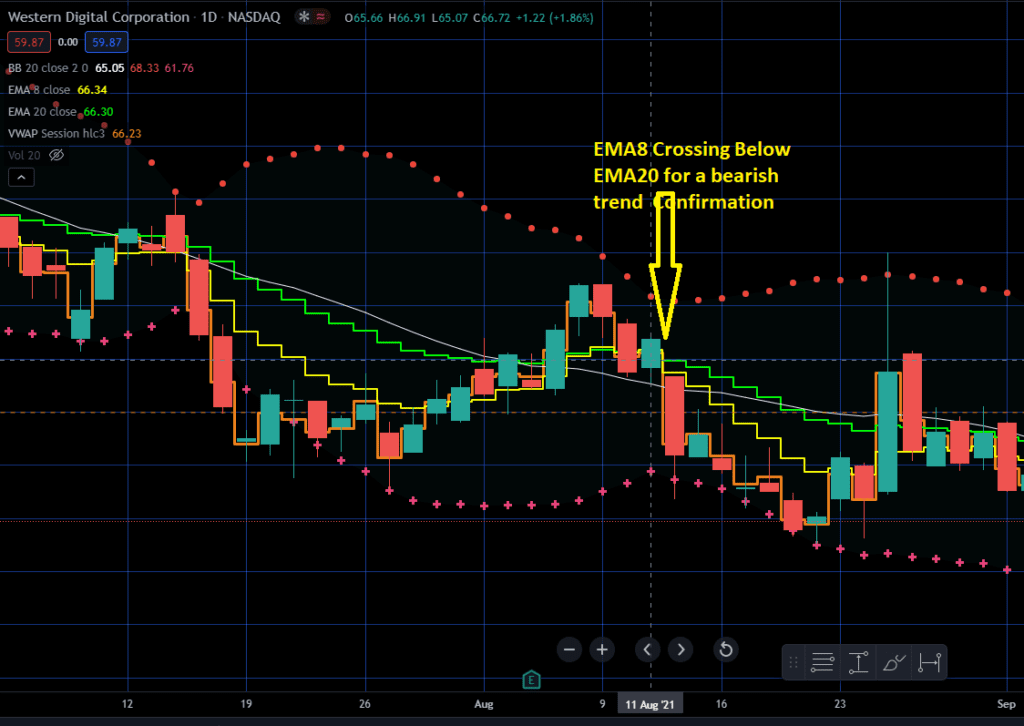
You can use these strategies on EMA8 crossing over EMA20 to set up bullish trades or EMA8 crossing below EMA20 to setup bearish trades.
Moving Average Convergence Divergence | MACD
The moving average convergence Divergence (MACD) is another classic indicator of options trader.
I do not use it as often as the other one to enter or exit mytrades.
However, it is good to check it for trend reversal from bullish to bearish and vice versa.
Relative Strength Indicator | RSI
The Relative Strength Index is a bottom chart indicator.
Most traders will set this one up with an upper threshold value of 70 to 80 to trigger overbought condition..
This means that the stocks is extended and may have a hard time going higher.
The opposite of overbouhgt is when the RSI indicator is below 30.
Such condition is known as oversold. Often, dip buyers are eager to point this out as a trigger for bullish reversal.
In my experience, the RSI does not consistently provide options traders with a clear signal on what tto do.
Why ? You may ask.
Stocks can stay oversold or overbought over a long period depending on the strength of whichever side (bullish or bearish) is dictating the direction.
VWAP Is The Best Indicator For Options Trading in 2022
The best indicator I use for options trading is the VWAP or volume weighted Average price.
In the next section will prove why it is a must have if you are serious about trading options.
What is VWAP Indicator?
VWAP takes into account how much volume is traded at each price level.
You can think of VWAP as the value price in the sense that if more traders are willing to buy a stock below VWAP, that means it is cheap.
Though some trader use the VWAP for daily charts, the most common use of it is for intraday trading.
Meaning when the market is open, you can use the VWAP on any time interval: it is the same value.
I do not se the envelope for VWAP as is the case for the Bollinger Bands.
Why Should You Learn This VWAP Options Trading Indicator
VWAP Indicator for options trading will help you easily identify when to enter a bullish or a bearish trade.
Therefore it takes the guess out of your options trading entries.
So many times I get the question from beginners traders: how do I know when to enter?
How To Use VWAP For Option Trading Entries
For each bullish or bearish scenario, the VWAP indicator clearly helps for entry because it is close to the price at the beginning of the day.
Unlike the Moving averages that can be far apart from the current price (think about gaps situation), the VWAP always tells which direction the stock in going after a reasonable number of candles.
On Bullish Entries with Calls Options
For a bullish entry, on the 5-minute or 15-minute chart, we need to see the price above the VWAP indicator and positing higher highs.
Then it is okay to take a bullish trade and ride momentum.
Here is the short video explaining how to trade a bullish setup using the VWAP indicator.
On Bearish Entries with Puts
You will recognize a bearish setup thanks to VWAP indicator when the price is below VWAP and the stock is posting lower lows.
As long as the price remains below the EMA8 which in this case will act as resistance as seen earlier, you can confidently stay on the trade to get bigger profit.
Bonus | My Best Option Trading Exit Strategy
Now after you successfully entered your bullish or bearish option trade using the our favorite indicator VWAP, the next question you may have is : When do I exit the position.
The huge advantage of the Scale Exit Strategy I use is that you get to take profits gradually.
At some point you end up playing with “the house money” without any stress.
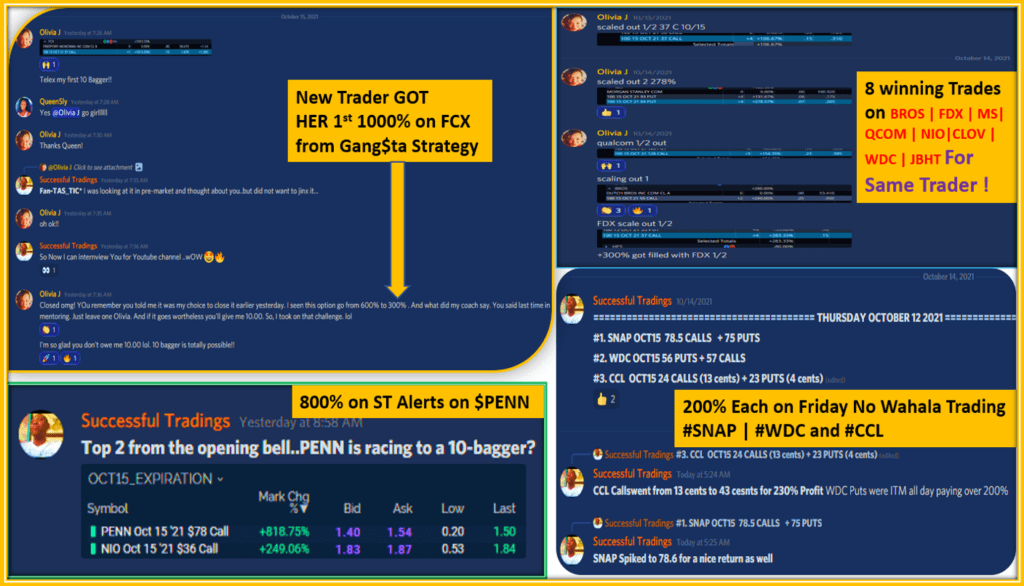
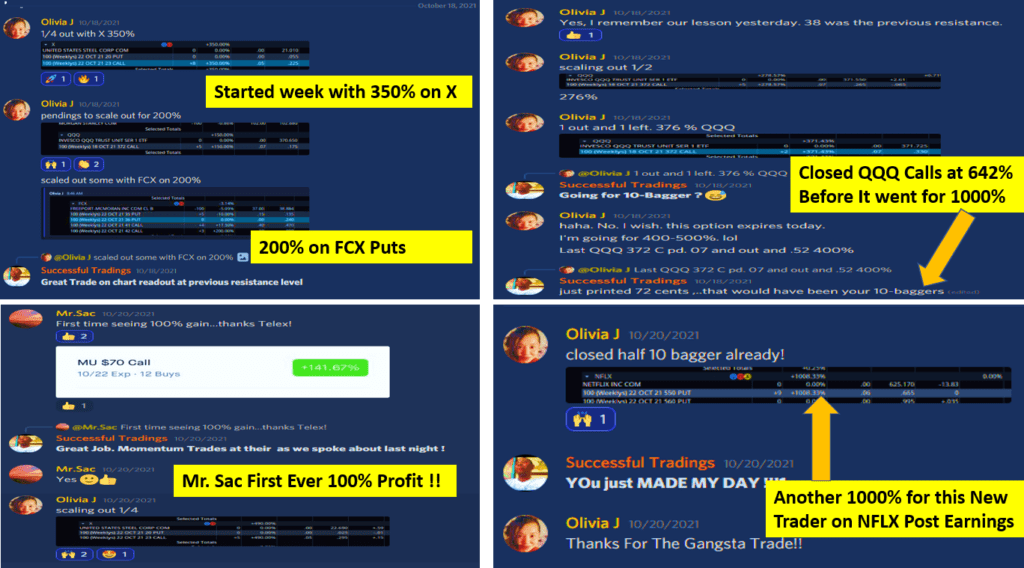
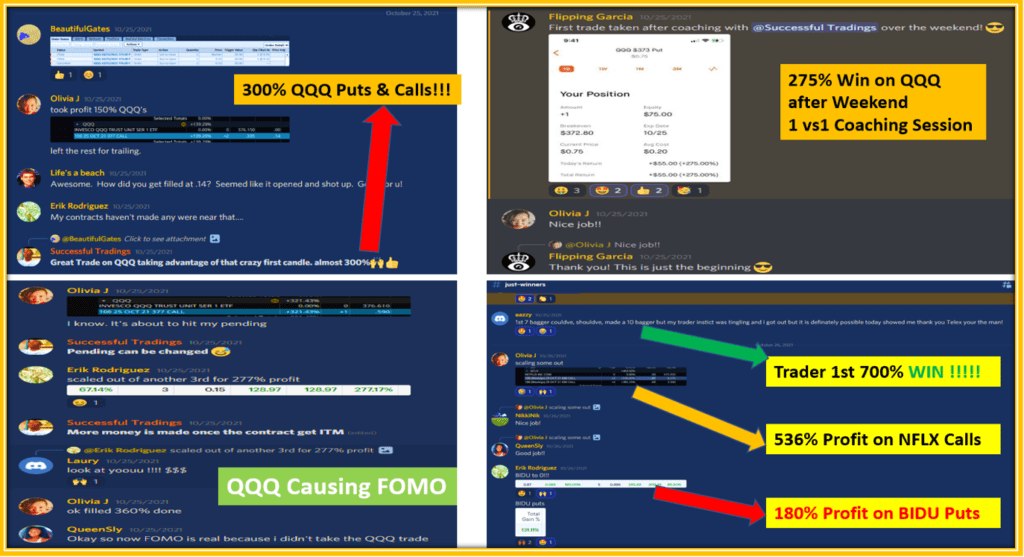
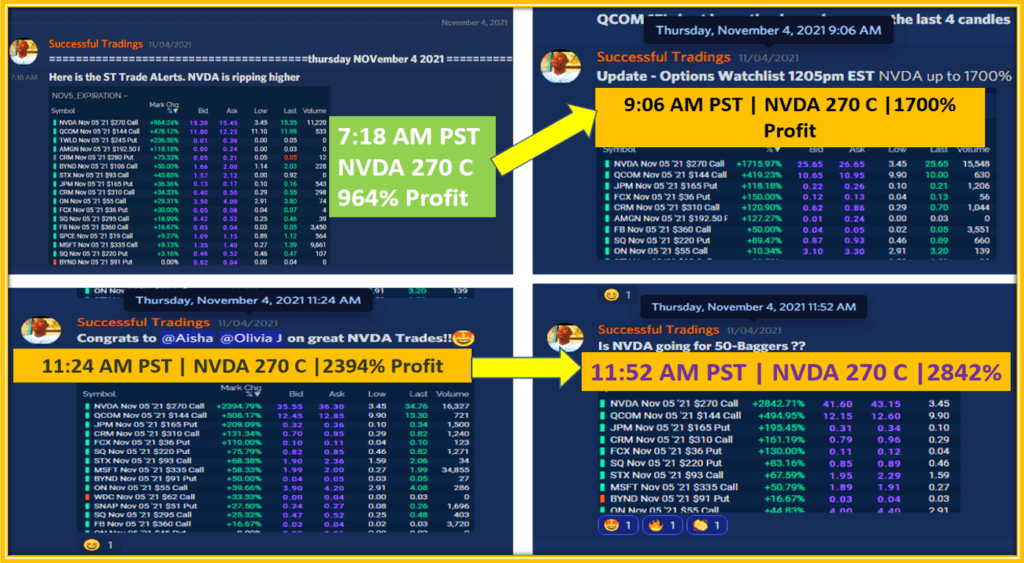
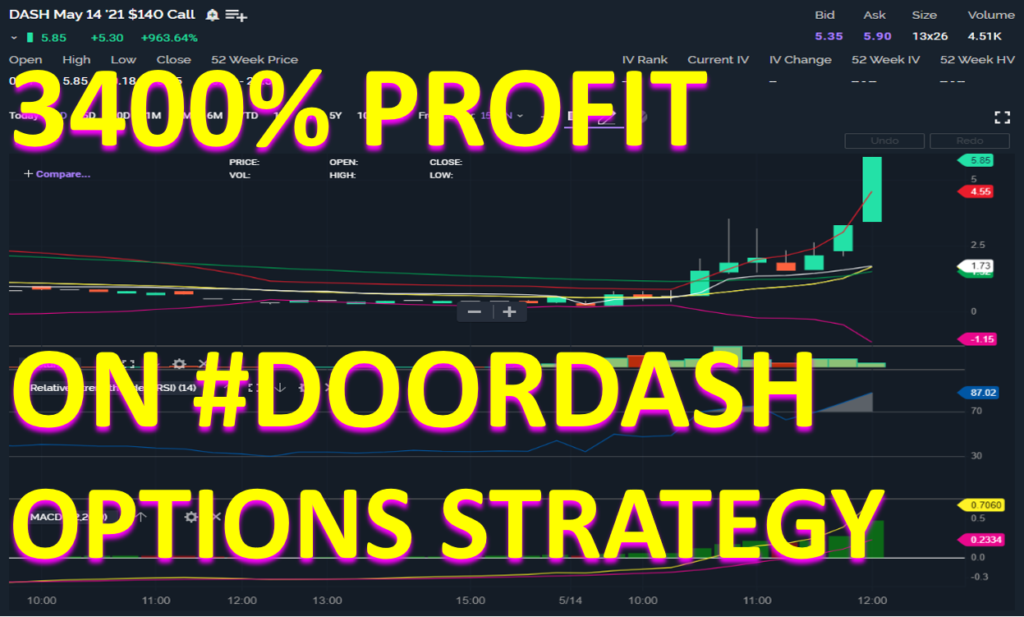
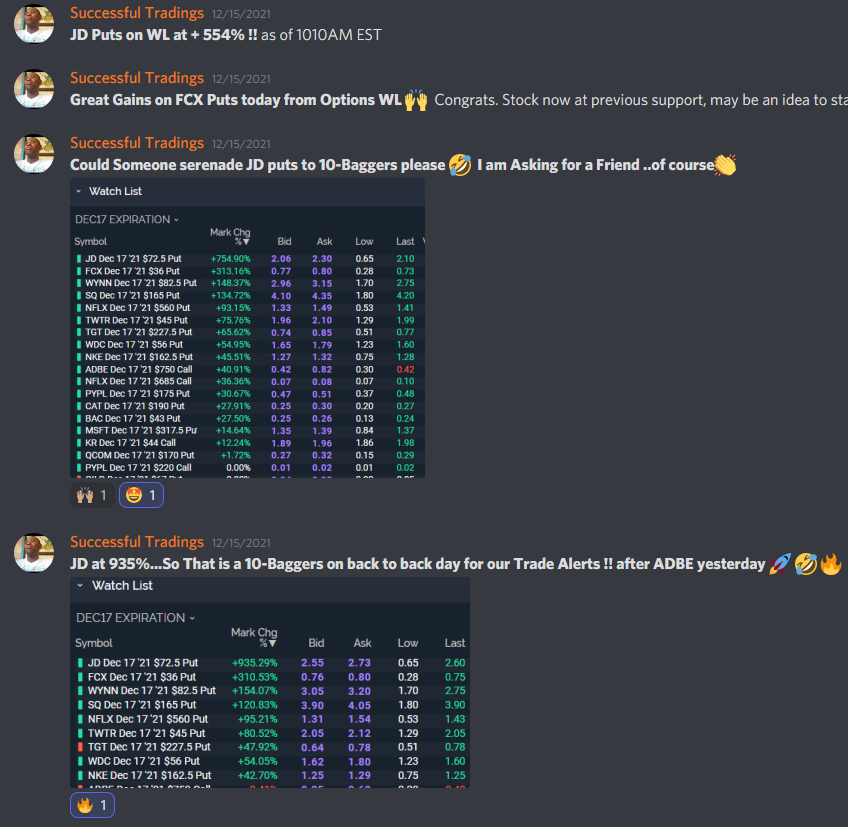
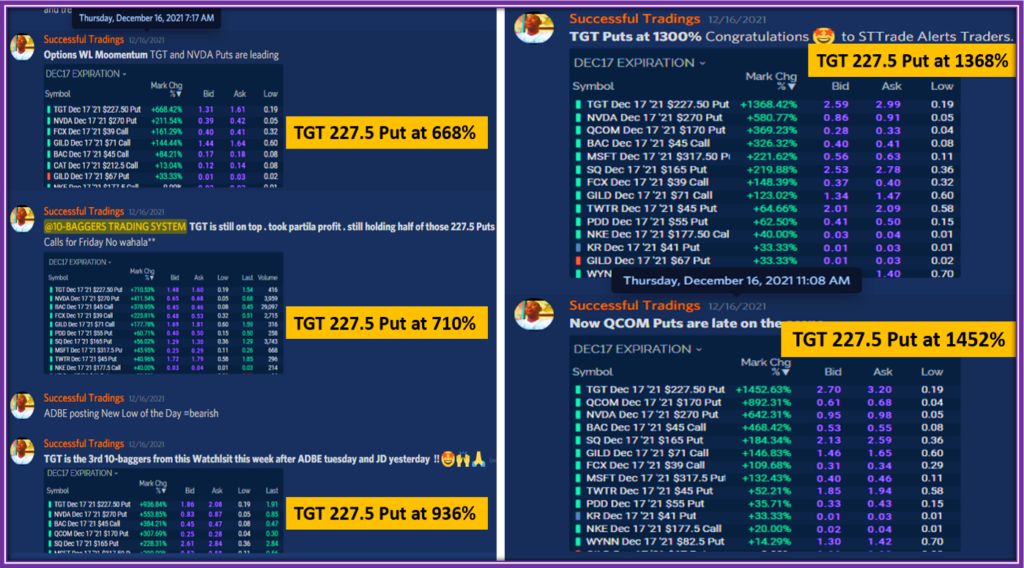
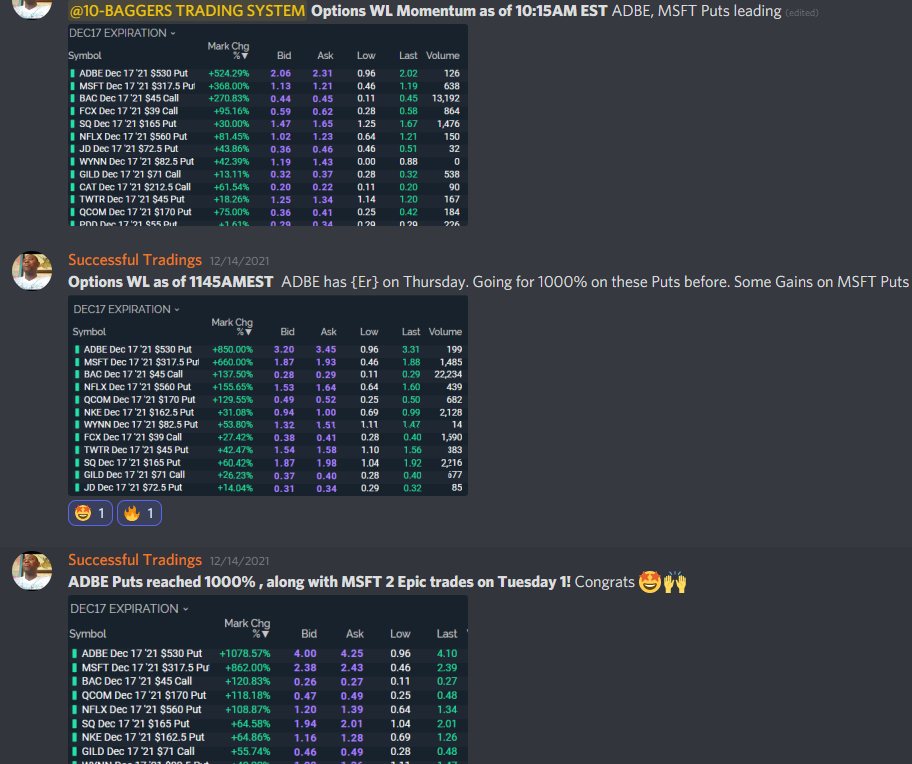
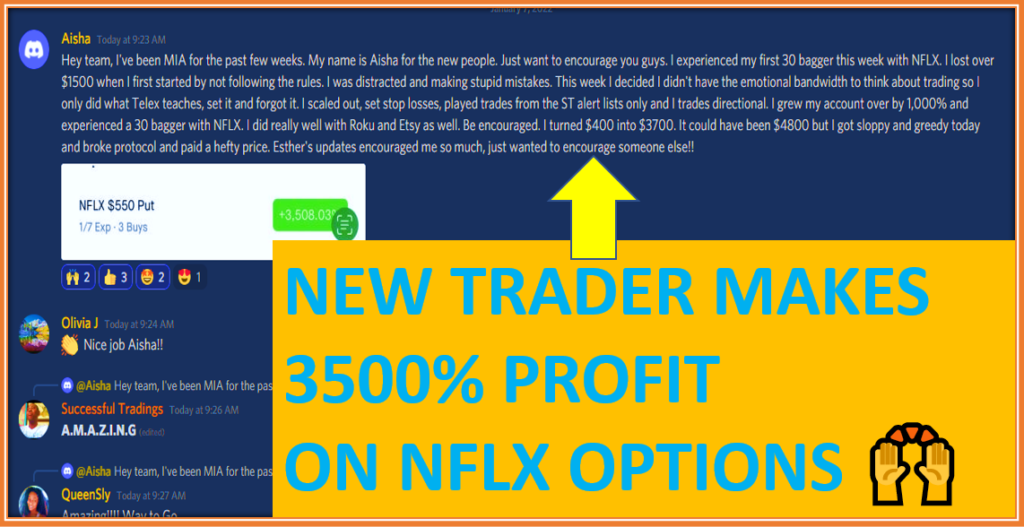
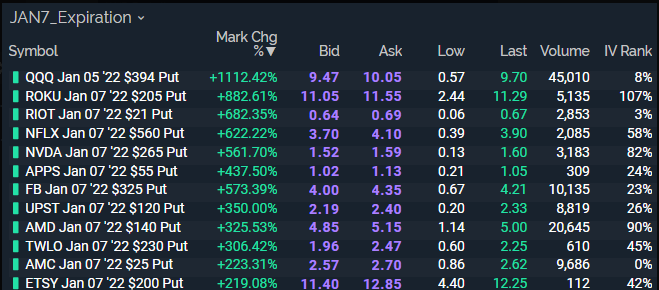
This is how we have been able to generate multiple 10-Baggers like the ones below.

Download My Scale Exit Strategy today for Free.
FINAL THOUHGTS
I shared my best options trading indicator in this step-by-step tutorial so that you can take your trading to the next level in 2022 and beyond.
If you are serious about options trading, I strongly recommend investing in your education so that you can Master Options Trading Skills that will last you for a lifetime.

Hold a Master Degree in Electrical engineering from Texas A&M University.
African born – French Raised and US matured who speak 5 languages.
Active Stock Options Trader and Coach since 2014.
Most Swing Trade weekly Options and Specialize in 10-Baggers !
YouTube Channel: https://www.youtube.com/c/SuccessfulTradings
Other Website: https://237answersblog.com/